Home Blog Page 10

Using Recycled Materials to Prevent Stormwater Pollution

Figure 1. Illustration of absorbent media trapping hydrocarbons and letting water pass through.

Although innovation is often defined as a new idea or product, it can also be used to describe finding a new use for an existing product. The unlikely story of how an oil spill absorbent became an effective control for stormwater pollution in Australia and the United States is a perfect example.

Repurposing Textile Waste
Every year, 92 million tons of textile waste is produced globally.1 To put that figure into perspective, this weight is the equivalent of 250 Empire State Buildings. Textile waste is a growing issue that’s facing increased significance, and one United States-based company has found a unique way to help tackle the textile waste problem. Halen Hardy specialises in spill control products and has developed a production method that takes old clothes, furniture and bedding, then breaks them down to base fibres. These fibres are then heat pressed to convert them into an absorbent media known as Spilltration Husky.

This recycled absorbent media has some impressive characteristics. First and foremost, it absorbs hydrocarbons. While water is absorbed, it is not retained by the material. These unique characteristics have made the absorbent media popular for use in traffic emergency response because oil and fuel spills can be absorbed while rainwater filters through the media (Figure 1). The ability to filter water is maintained, even when saturated by oil.

Figure 2. Polyethylene mesh provides structure and protection from vehicles traffic.


Utility for Sediment Filtration
A secondary benefit was discovered after the recycled absorbent media’s popular use as an oil spill absorbent. It was found that the absorbent could also be used to become a filter to trap sediment in addition to hydrocarbons.

To quantify its performance, the absorbent’s filtration performance was tested by an independent laboratory. A series of tests showed conclusively the material had the ability to effectively trap particles as small as 53 microns (0.053mm). For reference, particles of this size are finer than the average human hair.

The absorbent media’s unique construction plays a key role in its filtration ability. Fibres are bonded and heat pressed without the use of additives, and this composition enables water to be drawn into and wick through, helping to maintain filtration in sediment control applications.


Adding Durability for Long Term Usage
The recycled absorbent media showed promise for stormwater protection as a drain filter, however, improving its durability to withstand long-term foot and vehicle traffic presented a design challenge.

In its standard form, the recycled absorbent would result in piling and eventual disintegration when exposed to prolonged and direct contact. Extensive testing showed that these effects could be mitigated by adding a protective outside layer to prevent lateral movement of the absorbent media.

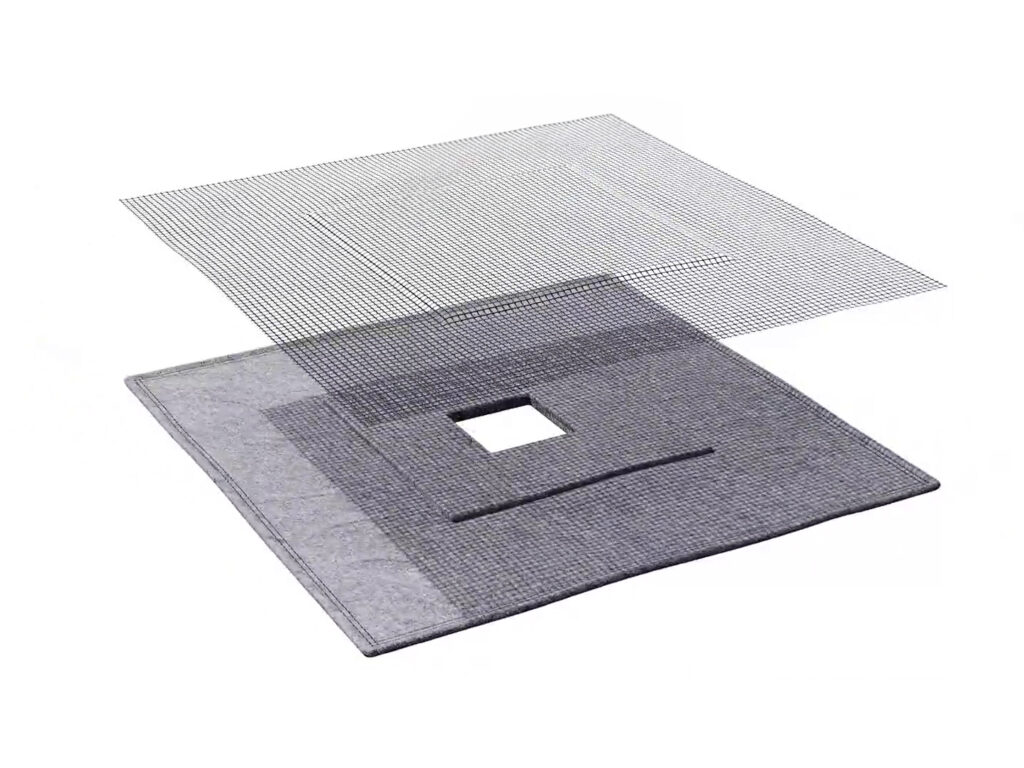
Polyurethane mesh was chosen to protect the absorbent media because of its UV resistance and inherent durability. The mesh is sewn directly to the absorbent media (Figure 2), with eyelets for added strength and to secure the drain filter in place once installed.

For maximum effectiveness in installation the drain filter is positioned over stormwater drains with a slight overhang. It is compatible with box, v-grate and side inlet stormwater drain types. Drain filters also feature a raised center section, which helps to create a damming effect to further improve the capture of sediment during heavy rain. Additionally, an overflow port helps to prevent water from backing up in heavy rain events. For side inlet stormwater drain systems, inbuilt aluminum strips are utilised to achieve a tight fit around curbs. The filter can be cleaned using a hose from behind to further extend its lifespan.


Real-world Applications
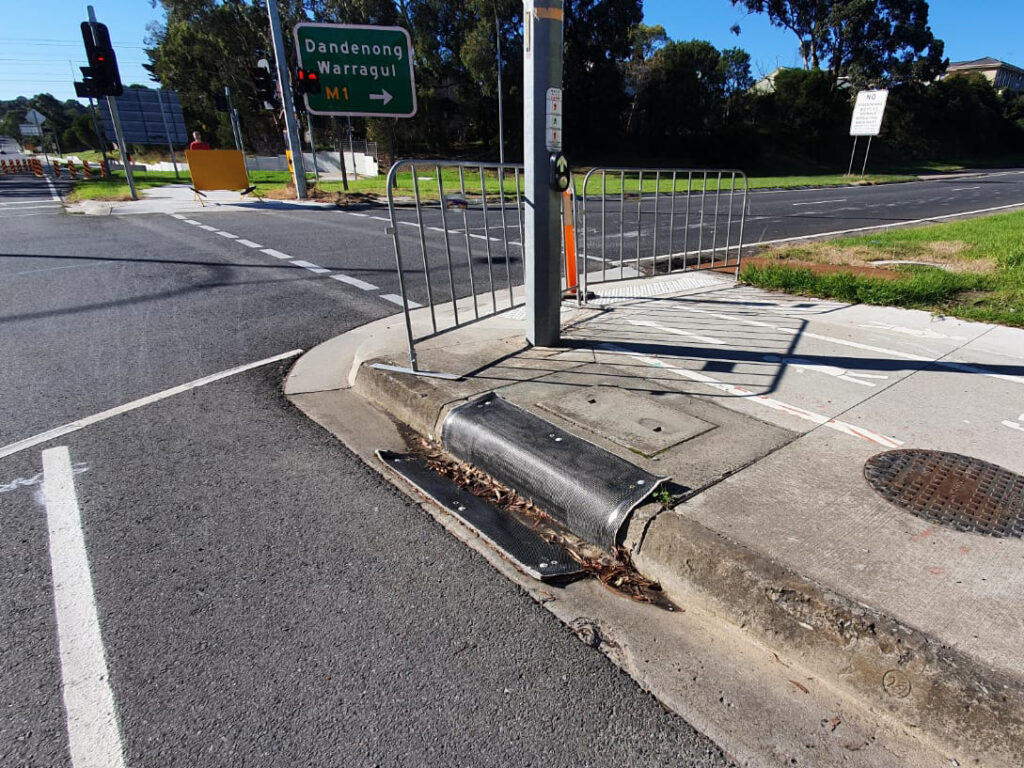
Construction sites, rail yards, car parks and gas, energy and manufacturing facilities are common risk areas for stormwater pollution that can benefit from the installation of a drain filter. In Australia and New Zealand, the drain filter is known as the GuardDog Drain Filter. In 2021, it was verified by the Innovation Sustainability Council as an Australia-first innovation for use on a major freeway upgrade (Figure 3). Since then, it has been used on countless construction projects. In the United States and Canada, the drain filter is known as the HuskyGuard. It has been specified as best management practice on major class 1 railroads and for the construction of a major petrochemical plant in Pennsylvania.


Benefits over Traditional Solutions
Aside from the sustainability benefits, the drain filter presents multiple advantages over traditional sediment control methods such as silt socks and drain pollution guards. The drain filter features a low-profile design, which improves safety for pedestrians and cyclists. Silt socks are also susceptible to splitting as they age or when driven over. This can result in debris spilling on the road and into stormwater drains.
Drain filters installed over stormwater drains make the prospect of an overloaded drain cavity unlikely. Moreover, time spent maintaining and cleaning filters is less than that of in-drain alternatives, as litter and debris can be swept away by hand or streetsweeper.


Moving Towards Sustainable Partnerships
Pollution prevention solutions such as the drain filter highlight the value of sustainable partnerships. Such partnerships extend beyond a conventional business relationship, due to a shared commitment towards environmental challenges. This synergy helps to bridge the gap between environmental responsibility and innovative solutions, resulting in a win-win for the stakeholders involved.

The relationships with end users who are seeking a fit-for-purpose solutions with additional sustainability benefits are very important. The value proposition of a stormwater pollution control device does not relate to the drain filter itself but to the journey towards jointly-crafted solutions that optimize performance, efficiency and environmental impact. 

Figure 3. Side entry GuardDog Drain Filter installed on the Monash Freeway upgrade project in Melbourne, Australia.

Reference

  1. Ellen MacArthur Foundation. A new textiles economy: Redesigning fashion’s future (2017).


About the Expert
Martin Brown is the marketing manager at Stratex, an Australian leader in environmental and personal protection solutions. He specialises in marketing and digital transformation and has worked with many of the world’s leading organizations in technology, healthcare, hospitality and safety.

Thinking of Forests and Beaches

Figure 1. Drone images of the Australian beach before (2019, top) and after (2021, bottom) nourishment. The seawall and building were removed prior to bringing the sand. A dune and vegetation established where the building was. Photo credit Brendan Kelaher, Southern Cross University.

This is the time of year when many folks are planning to head to the woods or the beach for a summer vacation, so here are a couple of studies in those areas.

Beach Protection

Beach nourishment is a common practice in which sand is added to an eroding beach as a way to reverse the erosion process at least temporarily, often to protect property and maintain recreational value. This process was initiated for a beach on an island 500 km off the coast of Australia in order to protect a vital road, and the transformation and stability of the nourished beach was monitored for a year after completion.2


The project involved moving sand from the northern part of a 1.34 km lagoon beach to the southern part, along with the removal of a dilapidated seawall and a building at the southern end. The lagoon has relatively low wave energy due to protection provided by sandbars and reefs. A commercial unmanned aerial vehicle (UAV) was deployed to survey the area before, during and after the sand was moved and for a year afterward. The photos were used to develop 3D orthomosaics from which changes to the beach topography could be determined.
A local resident was trained to perform the automated UAV surveys, which was critical due to travel costs and restrictions due to COVID. The survey results indicated that approximately 8,200 m3 of sand were moved, close (4% less) to the estimate based on truck volumes. At the end of the monitoring, 71% of the sand moved remained on the south beach (Figure 1). In addition, a new dune structure was established and vegetation was colonizing it. The slope of the middle and south ends of the beach declined, possibly due to accretion during the period. The authors found that the use of relatively simple and inexpensive commercial UAVs can be a valuable tool for monitoring similar types of projects.


Debris as Sediment Control

When you think of a forest area after a major fire, you may picture lots of burned tree trunks lying on the slopes. Could that debris be a substantial source of sediment control? That was the question that a team of researchers addressed for an area that burned in 1998 in southwest Montana, USA.1


They obtained high-resolution aerial photographs taken in 2016 and analyzed 55 areas 40 m in diameter for downed tree trunks of at least 28 cm in diameter, the minimum resolution in the images. The slope characteristics, log length and orientation of the logs relative to slope were determined and used this information to estimate the amount of potential storage based on available volume above the logs. Logs oriented more than 45 degrees from the flow direction were not included. In addition, the effects of slope and log orientation were tested on a tiltable table with a 5.1 cm PVC pipe representing a log and coarse sand poured at the top of the table representing eroded sediment.
Once a stable elevation above the simulated log was achieved, photographs were taken and used to develop digital elevation models for analyses. For logs of 25 cm and 50 cm in diameter, the storage potential averaged 0.5 and 2 m3, respectively. Taken over the 1 km2 watershed, there was 3,500 to 14,000 m3 in potential storage behind the two log sizes. Surprisingly, there was no correlation between the log distribution and slope characteristics or burn severity.
Tests on the tilted table also produced some surprising results. At 30 and 45 degree slopes, the coarse sand piled up behind the simulated log much higher than predicted, while at 60 degrees the predicted and actual volumes were similar. Little accumulation occurred when logs were oriented less than 30 degrees to the flow direction. Overall, the authors suggest that their estimate of potential storage could be conservative based on the tilted table results.  

References:

  1. Adams, K. V., J. L. Dixon, A. C. Wilcox, and D. McWethy. 2023. Fire-produced coarse woody debris and its role in sediment storage on hillslopes. Earth Surf. Process. Landforms. 2023;48:1665–1678. DOI: 10.1002/esp.5573.
  2. Kelaher, B. P., T. Pappagallo, S. Litchfield, and T. E. Fellowes. 2023. Drone-based monitoring to remotely assess a beach nourishment program on Lord Howe Island. Drones 2023, 7, 600. DOI:10.3390/drones7100600.


About the Expert
Rich McLaughlin, Ph.D., received a B.S. in natural resource management at Virginia Tech and studied soils and soil chemistry at Purdue University for his master’s degree and doctoral degree. He has retired after 30 years as a professor and extension specialist in the Crop and Soil Sciences Department at North Carolina State University, specializing in erosion, sediment and turbidity control. He remains involved with the department as professor emeritus.

Adaptive Strategies of Common Buttonbush at Developed Lake Margins

Figure 1. Study area.

Impounded lakes provide essential water supply, flood control and hydropower to cities worldwide, but they also inundate habitat, lose water by seepage and evapotranspiration, and capture sediment that takes up storage and would otherwise replenish downstream environments. Rivers and shore areas input most of the sediment trapped in built reservoirs, and unconsolidated deposits are especially vulnerable to wave erosion in shore areas.

Some forms of natural vegetation such as buttonbush (Cephalanthus occidentalis L. [Rubiaceae]) can bind shore sediment while providing a habitat for birds and other animals. Often found in floodplains and riparian zones, buttonbush naturally occupies parts of southeastern Canada and the eastern United States, extending westward to eastern Texas, Oklahoma, Kansas, Iowa, Wisconsin and Michigan.1 Scattered populations of buttonbush are also found in Arizona, New Mexico, southern California and northern Mexico.

Common buttonbush is a hardy shrub with an irregular crown, spheres of white flowers and button-shaped fruit.2 Buttonbush typically blooms in summer, produces fruit in early fall and reaches a height of approximately 3 m (10 feet) at maturity.3,4 Birds consume buttonbush seeds, mallards (Anas platyrhynchos) eat its fruit, wood ducks (Aix sponsa) use it for nests, and deer browse its foliage.5,6,7,8 Buttonbush also provides nectar to bees, butterflies, moths and hummingbirds (Trochilidae).9,10 Three types of moths, the hydrangea sphinx (Darapsa versicolor), titan sphinx (Aellopos titan) and royal walnut moth (Citheronia regalis), use buttonbush as a larval host.11
Buttonbush has no major insect, pest or disease problems.12 Along lake shores, buttonbush can form dense stands, with swollen bases that anchor shrubs and bind sediment.13,14 Through adaptation, buttonbush also tolerates disturbance from humans. A study along a segment of lake shore in north-central Texas explored adaptive strategies to wave erosion, pruning and mowing.

Study Area
The study area is located near the northern edge of Lewisville Lake in north-central Texas (Figure 1). This large, multi-use reservoir is impounded by an earthen dam located 16 km (10 miles) south of the study area. Lewisville Lake provides water to local cities and water authorities, controls flooding and supports recreation such as fishing and boating. The lake’s maximum normal operating level (conservation pool) is 159.1 m (522 feet) above mean sea level.15 The lake tends to rise above and fall below conservation pool each year, except during drought. Winds create waves that impact the study area from all directions, with a relatively strong SSE mode over a typical year.
Along the shoreline, a thin blanket of Quaternary alluvium (terrace) overlies bedrock of the Upper Cretaceous Woodbine Formation. In the study area, the Woodbine Formation consists predominantly of loosely cemented sandstone and clay. Overlying terrace deposits comprise sand, gravel and clay. Soil has formed and remains intact, but is eroding, on terrace deposits at the back of the shore.


Observations
Buttonbush was observed and photographed along a representative segment of developed shore. Photographs were taken on 22 May 2023, when lake elevation was 159.4 m (522.7 ft) above mean sea level.16 Buttonbush was growing in a narrow elevation range, within approximately half a meter (1.6 feet) of conservation pool. Shrubs were anchored into both alluvial deposits and the underlying Woodbine Formation.

Shrub heights ranged from less than 1 m (3 feet) to approximately 3 m (10 feet). At ground level, plant diameters ranged from less than 1 cm (0.4 inch) to approximately 10 cm (3.9 inches). Based on growth rings of cut shrubs and associated diameters, shrubs ranged from less than one year to approximately 20 years old. Having survived frequent wave action, and in some cases pruning and mowing from adjacent landowners, mature shrubs were binding sediment and providing habitat to various fauna.

Three adaptive strategies were observed: regrowth below pruned branches, root anchoring and seed dispersal. New branches typically emerged within a few centimeters (1 inch) of the cut level on a branch, often taking a similar trajectory to the pruned branch (Figure 2). In some cases, entire shrubs lopped off at ground level sprouted new stems around the perimeter of the stump.

Several shrubs had been undermined by wave erosion but were still thriving (Figure 3). Typically, undermined shrubs adapted by hardening exposed roots into three or more supporting legs connected at the top by the exposed root ball. Each supporting leg developed a new root ball beneath the ground for stability.

Exposed root balls document previous ground levels, thereby facilitating erosion rate estimates. For example, an approximately five-year-old, partially submerged shrub in one location of the study site indicates about 50 cm (19.6 inches) of denudation over five years, or 10 cm (3.9 inches) per year. Concurrently, the backshore terrace retreated about 1 m (3 feet) over the five-year period. Such erosion estimates can be useful to planners, to guide or prioritize restoration efforts that might involve additional plantings or other stabilizing structures.
Seed dispersal was the most important adaptive strategy. Nearly 300 seeds were counted in a single fruit ball in the fall of 2022. Dispersed seeds were examined on a contrasting, white paper background and appeared healthy: of characteristic shape, size and color; plump, full and fresh; devoid of shriveling, mottling or other damage; and free from pests and disease. Moreover, each mature shrub typically produced 20 or more fruit balls, thus releasing thousands of seeds per shrub. With such volume, even low survival rates result in considerable propagation. Seeds showed propensity to grow in Bermuda grass that invaded the study area, as well as in reworked sediment above hummocky bedrock.

Grass cover protected settled seeds from water and wind. Seedlings and shrubs grew in grass along the edge of the terrace and below the terrace (Figure 4). Typically, the edge of the terrace escaped mowing, but not less frequent string trimming. At the terrace edge, up to 20 seedlings were growing in a square meter of turf grass. In some cases, property owners trimmed Bermuda grass around buttonbush shrubs, preserving them as ornamental features for aesthetic value.

Seeds also settled into micro-depressions between hummocks formed by concretions in bedrock (Figure 5). Concretions form inside sediment shortly after deposition, as minerals precipitate from solution, sometimes as successive layers around a nucleus such as a granule, plant remnant or small shell.17 Between exposed concretions, which are relatively resistant to erosion, sediment and moisture accumulated to nurture seeds and support plants. Some plants were growing inside broken concretions. Eventually, roots propagated through cracks inside concretions, or into sediment between concretions, and anchored into more stable underlying deposits.

Conclusion
Buttonbush in the area is hardy, surviving not only frequent wave activity, but also indiscriminate pruning and mowing from adjacent property owners. Key adaptive strategies that include root anchoring, branch regrowth and seed dispersal, enable buttonbush to thrive in this setting. Buttonbush is valuable, providing habitat to various animals, stabilizing the shoreline, and enabling estimates of erosion rates to inform shoreline stabilization efforts. 


References

  1. LBJWC (Lady Bird Johnson Wildflower Center). 2023. Plant Database. Lady Bird Johnson Wildflower Center, Austin, Texas. Available from: https://www.wildflower.org/plants/result.php?id_plant=ceoc2.
  2. LBJWC 2023.
  3. Polomski, R.F. and Feder, B.H. 2020. Common Buttonbush. Factsheet HGIC 1098. Clemson Cooperative Extension, Clemson University, Clemson, South Carolina. Available from: https://hgic.clemson.edu/factsheet/common-buttonbush/.
  4. Wennerberg, S. 2004. Common Buttonbush (Cephalanthus occidentalis L.). Natural Resources Conservation Service, United States Department of Agriculture. Available from: https://plants.usda.gov/Document Library/plantguide/pdf/pg_ceoc2.pdf.
  5. Little, E.L. 1980. The Audubon Society Field Guide to North American Trees: Eastern Region. Knopf, New York.
  6. Niering, W.A. and Olmstead, N.C. 1985. The Audubon Society Field Guide to North American Wildflowers: Eastern Region. Knopf, New York.
  7. Parr, D.E., Scott, M.D. and Kennedy, D.D. 1979. Autumn movements and habitat use by wood ducks in southern Illinois. Journal of Wildlife Management, 43(1), 102-108.
  8. Wennerberg 2004.
  9. Snyder, S.A. 1991. Index of Species Information. Fire Effects Information System, U.S. Department of Agriculture. Available from: https://www.fs.fed.us/database/feis/plants/shrub/cepocc/all.html.
  10. Wennerberg 2004.
  11. Wheeler, J. 2017. Planting for Pollinators: Buttonbush. Xerces Society for Invertebrate Conservation, Portland, Oregon. Available from: https://xerces.org/blog/planting-for-pollinators-button-bush#:~:text=In%20addition%20to%20its%20attractiveness,walnut%20moth%20(Citheronia%20regalis).
  12. Polomski and Feder 2020.
  13. Polomski and Feder 2020.
  14. Wennerberg 2004.
  15. USACE (U.S. Army Corps of Engineers). 2023. Lewisville Lake. Lewisville Lake Project Office, U.S. Army Corps of Engineers, Lewisville, Texas. Available from: https://www.swf-wc.usace.army.mil/lewisville/.
  16. USGS (U.S. Geological Survey). 2023. Lewisville Lake near Lewisville, Texas. Available from: https://waterdata.usgs.gov/monitoring-location/08052800/#parameterCode=62614&timeSeriesId=139931&start DT=2022-01-01&endDT=2022-12-31.
  17. Todd, J.E. 1903. Concretions and their geological effects. Bulletin of the Geological Society of America, 14, 353-368.

About the Expert
Paul F. Hudak, Ph.D, is a professor in the Department of Geography and the Environment at the University of North Texas.

Removing PFAS from Precipitation-Induced Runoff from Land Application Systems

Figure 1. Setup to test the tracer dye and PFAS removal percentages as liquid leaches through a soil and sawdust blend. Each cylinder contains a different mix of soil and sawdust.

Water used to wash clothes and dishes, take baths and showers, flush toilets and mix with cleaning products makes its way from houses to wastewater treatment plants for people on public water and wastewater systems. After passing through the wastewater treatment process, the treated water is either discharged to the local waterbody or land applied for infiltration into the soil profile. At this point, wastewater system operators must also consider the erosion and sediment control practices that are in place to avoid contamination of waterways due to runoff after precipitation events.

Products that contain per- and poly-fluroalkyl substances (PFAS) or “forever chemicals” are commonly used in homes. These are synthetic chemicals that were originally synthesized in the 1930’s1 and have since found many different uses where waterproofing needs are desired. Some products that contain PFAS are Teflon™ pots and pans, waterproofing compounds, makeup and carpeting. PFAS are comprised of carbon-based compounds in which the carbon has been chemically bonded to fluorine atoms. With the high electronegativity of these carbon-fluorine bonds, a high activation energy is required to break these bonds making treatment and removal challenging.2,3
At some wastewater treatment plants, instead of discharging the treated water into a waterbody, the treated water is sprayed on a land application system (LAS). Land application systems can consist of grassed fields, forest or a combination of the two. These systems are covered under NPDES permits, and there is a requirement that no runoff should occur from the facility. However, during precipitation events, there could be runoff from the site causing soil erosion. This stormwater could carry chemicals on the surface of the LAS or attached to eroded soil particles. Around the LAS is a buffer zone to slow down and retain any soil, nutrients and other chemicals contained in the runoff. There have been some studies of buffer zones and their ability to retain and reduce nutrient levels as the water moves through the buffer zone, but there has been little to no research on the buffer zones’ ability to retain PFAS. A study is currently being conducted to answer some of these questions, but results are not currently available as samples from the project are being analyzed.
Along with the current research on buffer zone retention of PFAS, researchers at the University of Georgia are investigating the potential of using stormwater practices such as bioretention basins or modified versions to retain and remove PFAS prior to final discharge to local waterbodies. Initial studies involved the use of column studies to determine removal percentages of PFAS from a solution of six PFAS chemicals typically found in wastewater treatment plant effluent and applied to LAS. This solution consisted of the PFAS chemicals, perfluorooctanesulfonic acid (PFOS), perfluorooctanoic acid (PFOA), perfluorononanoic acid (PFNA), 6:2 fluorotelomer sulfonate (6:2 FTS), perfluorobutane sulfonic acid (PFBS) and perfluorohexane sulfonic acid (PFHxS). The objective of the column study is to determine if a combination of materials available at LASs in both North Georgia and South Georgia could be used to retain and reduce the concentrations of PFAS leaving LASs from precipitation-induced runoff.

In Georgia, the northern portion of the state is classified as Piedmont, and the soil profile is comprised of clay-based soils. The southern portion of the state is a coastal plain, and the soil profile is comprised of loamy sand soils. This study investigated the use of these two types of soil (a Pacolet Clay representing North Georgia and a Tifton Loamy Sand representing South Georgia) which could be found on the LAS site mixed with sawdust. Blends were made of soil and sawdust in ratios of 100%/0% (soil/sawdust) to 0%/100% with 20% changes in each portion of the blend. Each of the six mixtures was added to small stainless-steel columns that were 5.5 cm (2.2 inches) in diameter and 28 cm (11.0 inches) in length with screen mesh on the bottom to contain the mixture. Once the mixture was added, the columns were dropped from a height of 10 cm (4 inches) onto a surface to provide a consistent packing of the mixture. The columns were then hung from a rack and 500 mL (16.9 ounces) of liquid containing either a tracer dye or PFAS water was introduced to leach through the mixture. Collected samples were analyzed for fluorescence or PFAS concentration (Figure 1).

The analysis of PFAS removal percentages for the clay and sawdust (Figure 2) shows that as the percentage of clay decreases in the mixes, the removal percentages of PFAS also decreased. Some of this is related to the PFAS chemical in itself. The chain length of PFAS affects adsorption or desorption; shorter chains partition to water and longer chains are preferential to soil.4,5 The cation exchange capacity of the soil/sawdust mixture appears to have some affect on the removal pecentages of PFAS. As sawdust becomes the predominate portion of the mixture, the fluoresence of the collected sample, as indicated by the tracer dye values, increases. Some trees will naturally have a fluoresence due to the componds in lignin of the tree.6 The sawdust used for this experiment was collected from a local sawmill where the wood consisted of conifers as well as hardwood.

As the percentage of loamy sand decreases from 100% to 20%, there is not much change in the removal percentages of PFBS, PFHxS, PFOA and 6:2 FTS (Figure 3). PFOS and PFNA have higher removal rates in the 100/0 mixture while the percentage of removal generally decreases with increasing sawdust until the 0/100 mixture. At 0% soil, five of the chemicals increase in removal percentage. With this soil being a loamy sand, the attraction to the soil particles could be causing a lower adsorption rate and therefore a reduced removal percentage for the PFBS, PFHxS, PFOA and 6:2FTS. Clay soil typically has a negative charge, while sandy soil may have slight negative or no charge.

The research is continuing, but the potential of using on-site materials as well as materials that are collected from citizens in county/city-based debris removal can potentially be cost-effective ways to capture and retain some of the PFAS that potentially could be in precipitation-induced runoff from LAS sites where this system is used. 


References

  1. Moyer M. (2021). “Forever Chemicals”: PFAS Contamination and Public Health. Penn State Law Review, 2021. https://www.pennstatelawreview.org/print-issues/forever-chemicals-pfas-contamination-and-public-health/. Last viewed 16 January 2024.
  2. Zhang Z, Sarkar D, Biswas J K, et al. (2021). Biodegradation of per- and polyfluoroalkyl substances (PFAS): A review. Bioresource Technology, 2021, 1–11. https://doi.org/10.1016/j.biortech.2021.126223.
  3. Drenning P, Volchko Y, Ahrens L, et al. Comparison of PFAS soil remediation alternatives at a civilian airport using cost-benefit analysis. Science of the Total Environment, 2023, 1-11. http://dx.doi.org/10.1016/j.scitotenv.2023.163664.
  4. Huang Y, Liu S, Zi J, Cheng S, et al. In Situ Insight into the Availability and Desorption Kinetics of Per- and Polyfluoroalkyl Substances in Soils with Diffusive Gradients in Thin Films. Environmental Science and Technology, 2023, 7809-7817. https://doi.org/10.1021/acs.est.2c09348.
  5. Seo S, Son M, Shin E, et al. Matrix-specific distribution and compositional profiles of perfluoroalkyl substances (PFASs) in multimedia environments. Journal ofHazardous Materials, 2019, 19–27. https://doi.org/10.1016/j.jhazmat.2018.10.012.
  6. Djikanovic D, Kalauzi A, Radotic K, et al. Deconvolution of Lignin Fluorescence Spectra: A Contribution to the Comparative Structural Studies of Lignins. Russian Journal of Physical Chemistry A, 2007, Vol. 81, No. 9,pp. 1425–1428. DOI: 10.1134/S0036024407090142.

About the Experts
Gary L. Hawkins, Ph.D., is an associate professor and water resource management extension specialist at the University of Georgia.
Bailey Williams, B.A., is a graduate student in the University of Georgia Crop and Soil Science Department.

Enhancing Stormwater Management: The Automated Outlet Structure

Figure 2. A combination of automated controls and a park-like setting in an Ohio project augments flooding storage and ensures that dams adhere to Ohio Department of Natural Resources regulations.

Stormwater detention systems gained prominence in the mid to late 20th century as environmental awareness grew. In the United States, The Clean Water Act of 1972 played a pivotal role in regulating water pollution and promoting stormwater management practices. Since then, stormwater detention has become a standard component in urban and suburban stormwater management plans to mitigate runoff impacts.

Storage and treatment systems, including detention and retention ponds, typically have a lifespan of 20 to 30 years. Systems constructed before the 1990s are now reaching the end of their useful lives and are often undersized considering current stormwater management practices and climate change impacts. The trajectory of urban flooding impacts is expected to rise due to the inability of older stormwater assets to accommodate changing rainfall patterns and intensity. Challenges such as downstream erosion, sedimentation and delays in peak flows have accumulated over time, contributing to significant changes in the watershed’s natural hydrologic conditions.
Even with stormwater regulations in place, the growth of some areas since the 1970s affects the effectiveness of practices used to control flooding. Patton Creek in Jefferson County, Alabama, will overtop its banks in urban areas, and flood a state highway and businesses following a 3.5-inch (89-mm) rain. The characteristics of the creek basin changed over time from a rural to high urban footprint. Even with stringent stormwater regulations, the creek is still a prominent flood source. Conventional methods to fix the flooding require costly, invasive modifications to the stream to increase its capacity and severely restricts new development.

Figure 1. The basic logic sequence of the automated outlet system.


Outlet Control Options
One of the less invasive methods used to manage stormwater flow and reduce the risk of flooding is the use of conventional outlet control structures (OCS). They are designed to regulate stormwater flow from a detention basin or pond to prevent downstream flooding and erosion. However, conventional OCSs have limitations, including delayed peak time, inflexibility to high-intensity storms, high clogging potential and increased pond volume requirements.

Conventional OCSs are calibrated to a design storm, a synthetic event that does not account for multiple peak intensities or changes in antecedent moisture conditions. This limitation, coupled with the dependence on depth for release rate adjustments, poses challenges in adapting to high-intensity cloud burst events from today’s storm patterns.
For situations like Patton Creek in Alabama, an Automated Outlet Structure (AOS) provides a non-invasive approach to correcting the problem because the systems are installed offline of the creek by retrofitting in existing ponds and lakes — attacking the problem at its source. This method restores not only the creek, but also the existing streams that flow into the creek, which is good for environmental habitats, pedestrians, homeowners and businesses throughout the watershed.
Flood-Con’s AOS is an intelligent device that replaces the traditional outlet structure. It can be described as a robot dam that is comprised of a rain gauge, depth sensor, mechanically controlled gates and an onboard microcontroller. The microcontroller is the brain that takes readings from the rain gauge and depth sensor and uses those readings to open the gate to a specific width to control the release of water from the pond.
The microcontroller has programming that uses hydrologic factors specific to the pond and the watershed. Using this intelligence, the outlet structure requires anywhere from 30% to 50% less volume of pond to meet regulatory requirements. For aboveground ponds, this results in less disturbed land and more property to develop, which creates more value for the developer. In a Hoover, Alabama, residential subdivision, the Automated Outlet Structure reduced the depth of mass rock excavation by up to 4 feet (1.2 m), resulting in shallower stormwater ponds.

For underground ponds, an AOS provides significant savings to the developer in materials and construction cost. An AOS at Bellmont University in Nashville, Tennessee, contributed to a 35% reduction in the volume of underground detention and minimized the footprint of the underground pond, enabling the pond to seamlessly integrate with the site’s limitations.
An AOS incorporates one or more gates that incrementally open and close, allowing horizontal or vertical control of stormwater flow from the detention pond. Unlike traditional structures, the AOS is at one invert elevation to optimize the pond’s full volume. The device is normally installed in reservoirs or water bodies such as a stormwater pond or lake. It also can be easily retrofitted in existing water bodies to prevent pond expansion.

A solar panel powers the automated system, ensuring continuous operation with a 12-volt battery that provides up to 30 days of backup power if the solar panel fails. During a rain event, the onboard microcontroller calculates predevelopment flow and required gate open area at set intervals based on rain and pond depth readings.

The system uses 5G-LTE cellular communication to transmit vital device health information during rain events to report key metrics. Even without cellular connectivity, the outlet structure continues normal operation. Each system incorporates site-specific data to calculate reduced pond staged storage and determine the required AOS maximum open area to meet municipal stormwater management requirements (Figure 1). Additional sensor setups include turbidity, total suspended solids, oil, dissolved oxygen, conductivity, Mono Ethylene Glycol and Mono Propylene Glycol and pH.

Beyond detention, every system can provide forecast-based release for retention (wet) ponds to offer flood mitigation and emergency management capabilities. Redevelopment of the existing Barlow Dam, located in Hudson, Ohio, included modifications aimed at increasing regional flooding storage capacity by an additional 9.5 acre-feet (11,718 m3). The project included upgrading active controls, enhancing flood stormwater storage and incorporating an aesthetically pleasing design. The device installed in the Barlow Dam also has the capability to remotely provide a pre-event release to provide additional storage capacity for flood mitigation (Figure 2).

Similar to conventional outlet control structures, each AOS is tailored to the unique characteristics of the watershed it serves, ensuring optimal performance in managing runoff. The versatility of AOS extends across a spectrum of watershed sizes and flow rates, accommodating areas ranging from half-acre (0.2-ha) plots to expansive one-square-mile (2.59 km2) regions. Specialized AOS units are capable of effectively regulating peak flows of up to 700 feet3 per second (20 m3 per second).

Given the variability of stormwater regulations across different jurisdictions, an annual maintenance and monitoring agreement ensures compliance by providing notifications and complimentary access to a website console for the engineer of record, property owner and regulatory authority. Biannual inspections conducted by Flood-Con authorized representatives include detailed reports and photos that are uploaded to the website console to fulfill local post-construction stormwater BMP inspection requirements, where applicable.

The key benefits of an AOS include:

  • Typically provides 35% less storage volume than a traditional outlet structure, which requires less land for detention, achieving an average savings of $45,000 per developed acre.
  • Adjusts to actual rainfall in real-time, continues to attenuate flow after the peak of the event and manages the timing of the peak flow to prevent downstream basin peak flow contributions.
  • Applies a recession algorithm to prevent extended high flows that typically occur with conventional OCSs.
  • Performs daily diagnostic routines and hourly sensor monitoring every day and provides time-stamped data at intervals as often as one minute. Notifications of noncompliant conditions are sent to authorized representatives, and proof of compliance for every rain event is provided with real-time data to a computer or smartphone.
  • Prevents clogging with a self-flushing adjustable weir.
  • Serves as a tide gate for backwater prevention during high tides and withstands tailwater and submerged conditions.
  • Maximizes infiltration volume for green infrastructure practices and stores runoff for water reuse.
  • Updates remotely to allow for watershed calibration.
  • Installs inside a concrete box that meets local agency specifications.


All logic is entirely housed on the AOS. The AOS sends health data every three hours when not in a storm event. This health data generates SMS and email alerts to authorized representatives if vital signs fall below specified thresholds. The alerts are sent directly from the device or through cloud-based application programming interfaces and a browser-based flow editor, incorporating onboard maintenance routines for gate functionality. Any issues can be remotely troubleshooted through commands sent to the device. Aboveground components are typically limited to a rain gauge and solar panel (Figure 3).

Figure 3. Aboveground rain gauge and solar panel can be installed up to 250 feet (76 m) away from the device to enable mounting on parking lot light poles and in landscape islands within paved areas.


Conclusion
The standard practice for stormwater detention is outdated and needs to be revolutionized. Automated controlled release is an example of the benefits of incorporating new technology into stormwater management practices. For example, on a 5-acre (2-ha) commercial development, Flood-Con’s

AOS halved the volume of underground detention, saving nearly $200,000 in construction cost. Given the availability and cost-effectiveness of this technology, a paradigm shift in stormwater management is essential to combat flooding from a local and regional perspective. 

About the Expert
Jon E. Rasmussen, PE, CPESC, LEED AP BD+C is president and CEO of Flood-Con LLC, an automated stormwater management company that provides cutting edge technology through its patented products and engineering services.

Effective Continuous Total Suspended Solids Measurement

Figure 1. A typical in-stream TSS monitoring unit located in a stream running through a new residential subdivision with many sections still under construction.

Erosion control on construction sites in Auckland, New Zealand’s largest city is an ongoing challenge. Auckland is on an isthmus with many coastal catchments and significant areas of fine clay soils. An annual average rainfall of 44 inches (1,118 mm) per annum, most of it in winter, and marine climate conditions that frequently have rainfall of one to two inches (25 to 50 mm) within one hour1 combine to create the need for complex, innovative solutions to control erosion sediment.

In 2017, Mote Ltd., a technology company specializing in real-time remote monitoring of environmental and technical data, was approached with a brief for a motorway project about to be built a short distance north of Auckland. The brief estimated that the construction site would have over 200 sediment control devices operating as it cut through steep terrain in three catchments. Compliance would be labor intensive. The call was out to see if monitoring could be undertaken with low cost instruments.

Mote’s core competency is using networks of optical light scattering instruments to measure particulate matter suspended in the air to monitor air quality. Over the last 20 years air quality monitoring instruments have moved to a point where real-time particulate concentrations in air are reliably and accurately measured in mass per volume (g/m3) at an increasingly lower cost. Because total suspended solids (TSS) are particulates in a different suspension fluid, the search began for low-cost instruments to remotely monitor and measure total suspended solids.

A New Zealand-made, multi-beam optical instrument, designed and built to measure milk-solids content in milk for dairy factory application was evaluated. The instrument has an interesting combination of performance aspects all applicable to the measurement
of TSS.

As a multi-beam instrument, it has a number of light sources and receivers and conducts a series of direct path (absorbance) and angular (scatter) measurements. These measurements are mathematically combined to provide higher quality data, by reducing the effects of color and clarity on the measurement, as well as giving a correction for fouling of the optics. A limitation of the device, however, was that it was not designed to provide particle size information, which is common for particle measurements in air, but makes the instrument ideal for the direct measurement of solids suspended in water.

The result is an instrument ideally best used for direct measurement of total suspended solids rather than calibrating the instrument for turbidity. While we can measure turbidity in Nephelometric Turbidity Units, the benefit is in accurate direct measurement of TSS, within certain constraints, which should yield a better result.

The first task was to characterize the performance of the instrument. This led to the identification of perhaps the biggest weakness of suspended solids monitoring using optical devices.

There is an international standard, ISO7027, that specifies the measurement of scattering of near infrared light centered on 90° which was introduced to improve comparability of turbidity data. While outputs of different ISO7027 compliant turbidity sensors are strongly linearly related, they can still range about two-fold in magnitude in different test suspensions, with just tiny variations in the design of the instruments.

Turbidity data is numerically ambiguous because turbidity is not an absolute measurement. Turbidity is only a relative measure of light side-scattering which indicates relative TSS concentration or water clarity.

Consequently, turbidity is also poorly comparable on different instruments. The result is that laboratory methods, such as formazin-based turbidity measurements, are of limited value. To estimate actual TSS concentration requires local calibration of the instruments, which incorporate the normal optical to gravimetric conversion factors. This left little option except to push the units straight out into the field for testing.

A range of river installation hardware was designed specifically to reduce measurement noise from reflections and ambient light. All contained an internal pump to assist with cleaning. Most units are tethered from the shore line with a rigid support structure or a stake in the waterway (Figure 1). For some applications, the instrument is mounted on a floating platform next to settling pond skimmers.
The final piece of hardware applied to these instruments in the field is driven by the need to take calibration grab samples for analysis, such as co-location, using a laboratory method recognized by regulatory requirements.

A low cost, portable auto-sampler that was event driven — rainfall, water measurement, individual or network triggered — for operation in remote locations was built.

This package yielded some innovation in the method used for compliance monitoring.

  • Real-time Data — Measurement of qualitative TSS rather than using turbidity as a surrogate with this method gives information that is real time and easy to understand (relevant measurement units), which means that timely action can be taken by project managers. This method also provides higher quality data by improving precision and reducing effects such as absorbance (color) and reflectance (clarity).
  • Data Verification — The addition of a low cost, quantitative auto sampler supports data accuracy and enforcement.
  • Social Contract — By splitting qualitative and quantitative monitoring, a new social contract is produced by allowing transparent information sharing. Data from the TSS instrument is telemetered and can be simultaneously shared, in near real time, with all parties, including regulators, contractors and stakeholders. Qualitative data is important to contractors and stakeholders, while regulators still require physical quantitative samples for enforcement. This eliminates an area of potential conflict when it comes to data sharing and transparency.

For some sites there is a straight compliance cost efficiency for this method when compared with rainfall driven manual grab-sampling or typical auto-sampler response solutions. Another use of the technology is continuous measurement of TSS in waterways upstream and downstream of projects to show compliance and impacts of site works.

However, demand for this innovation is now starting to come from contractors and regulators who are trying to manage too many sites with too few personnel. Both contractors and regulators find that they can often spend time investigating complaints from stakeholders incorrectly apportioning responsibility for discolored water. Hence, there is a desire to find a common shared platform to oversee working sites.

The addition of low cost, networked samplers allows for both calibration of the in-water instruments as well as collection of samples to validate measured events using standard laboratory analysis methods.
A combination of services that measure both qualitative and quantitative TSS on and near construction sites can significantly change the existing relationship dynamic between stakeholders, contractors and regulators by providing transparency, which produces better environmental outcomes.

Reference

  1. Chappell PR. The Climate and Weather of Auckland. 2nd Edition. NIWA Science and Technology Series Number 60 ISSN 1173-0382.


About the Expert
Brian Mills, MSc, is a consultant scientist with Mote Measurement Networks.

Nuisance Flood Resolution and Private Landowners’ Challenges

Figure 1. An ice flood in 2014 was only one event throughout the years that flooded the neighborhood.

In autumn 2013, a series of storms, including Hurricane Dorian, impacted a swath of the country from the Midwest to the East Coast. For one neighborhood in Cook County, Illinois, commonly referred to as the College Streets, this impact was only one in a series of ongoing flooding (Figure 1) that had been increasing as development and climate change increased. The neighborhood was overlooked for improvements because it was in an unincorporated area of the county, in a township that had no public works. These little pockets of unincorporated neighborhoods were a byproduct of communities incorporating over time and leaving fragments of the county unincorporated — primarily because of socioeconomics. Over time, resistance to incorporation was stronger because of lower property taxes. These fragmented neighborhoods generally fell to the townships for support.

The 2013 storms allowed for grant funding through the Community Development Block Grant (CDBG) Program funded by the Federal Emergency Management Agency and for use within the Cook County Metropolitan Water Reclamation District. On behalf of the neighborhood, the township requested funding. While affluent communities generally do not qualify for CDBG funding, the township argued that blight could be avoided with improvements to alleviate the repetitive flooding, and the request was for a very small portion of the $14 million available. These arguments allowed for the neighborhood to qualify for CDBG funds.

Figure 2. Feasibility study results.


The first phase of the project paid for a study of the existing infrastructure to identify the worst areas that were contributing to the drainage and flooding problems. The neighborhood included a range of pipe systems and old infrastructure. Studying the old engineering plans, this infrastructure included brick drop-ins, corrugated metal pipes, polyvinyl chloride (PVC) pipes, concrete channels and grassy swales with little infiltration. Natural resource areas were overrun with invasive cattails that stressed the limits of filtration by the buildup of sediment and lack of maintenance. The water in the neighborhood circled through the pipe system and settled at the lowest section of the land. Once at this point, the water would often sit for days until infiltration (Hydrologic Soil group C) would occur.

The conclusions from the study (Figure 2) were used to develop three potential solutions to the drainage and flooding issues by upsizing drainage pipes and installing bioswales. Challenges to implementing this phase of improvements involved private property issues. While one neighbor could be impacted by the addition of a grass swale and improved pipes, they were not willing to sign off on the ideas proposed.
Even after encouragement of friends, legal teams and public hearings, the homeowners were reluctant to agree to any plan that involved private property. Over the course of two years of negotiations, significant rainfall and flooded roadways (Figure 3) did nothing to encourage cooperation. Ultimately, the township determined that working on the problem solely in the right-of-way was the only way to address the problem.

Finally, in the spring of 2017, a second application for CDBG funding was secured for the design of a drainage and flooding improvement plan. A public bid was released to create a bioswale in the right-of-way at the corner where most of the stormwater accumulated following a rainstorm. The drainage and flooding improvement plan also upsized the piping system that ran adjacent to the private property and across the roadway right-of-way. Features of the swale included an underground system of varying levels of rock for retention and infiltration and a surface layer of amended soils that would hold native plant material and be an attractive feature of the neighborhood.
The final design plans were implemented in the late summer of 2017 after one more flood event in the spring, with a promise of five years of maintenance beginning in 2018. There was a good effort to implement the maintenance until the pandemic hit in 2020, and the site was left fallow. With the training of the landscape team and a conservation program initiated by a local conservation organization, the site was revived and replanted (cover photo). Of note, even during the time the site was fallow, the bioswale functioned as intended. There have been no flooding issues since the bioswale was installed even in significant storm events.

Lessons Learned
When a project is ongoing it is good to wait for the right funding opportunity and never be afraid to ask if a project qualifies. The search should involve diligence, collaboration and sound arguments for advancing the project. Keep in mind that funding agencies are trying to stretch their funding responsibly and to advance their own goals. Aligning project goals to agency goals is the key to accessing sometimes difficult funding sources.

Homeowners can pose challenges to implementing and maintaining green infrastructure even when their health and safety is at stake. Patience, encouragement and counsel is needed when dealing with landowners. Understanding and explaining both positive and negative impacts to their neighborhood is a key element to successful work with private homeowners.
Bioswales work! The concept of creating underground retention areas that have minimal impact on the soils and infrastructure has been in play for centuries. Surface soils can be stylized to accommodate and enhance neighborhood features making a good bioswale both functional and aesthetically pleasing. Defining them too rigorously with tightly designed parameters discourages landowners from using them.

The final report for the project is due in spring 2024. Developing and implementing science and engineering-based solutions to nuisance flooding can be accomplished, but it does not happen overnight. Patience as well as funding to design, construct and implement the process is the key to success. 

Figure 3. 2017 neighborhood flood emphasized the need for upgraded infrastructure to manage flooding.

About the Expert
Nancy Schumm, PWS, CPESC, CMSM, QPFSD, CESSWI, is the award-winning author of two books on natural areas and plant history and four books on history and has been lecturing and presenting papers on environmental topics since 1997. She is the environmental services division chief for the City of Gaithersburg, Maryland. She is vice president of the Mid-Atlantic IECA, on the board of the International Erosion Control Association, a technical advisor for Envirocert-International and the vice chair of the Wetland Workgroup for the Chesapeake Bay Program.

Checking In on Restored and Wild Streams Over Time

Stream restoration projects are usually intended to improve fluvial processes and stability and to restore ecological functions. Langhammer et al. (2023) evaluated three of these projects near Prague, Czech Republic, for up to six years after completion using unmanned aerial vehicles (UAVs).1 The UAVs were equipped with 16–20 megapixel cameras and flown at 60–75 m twice per year in the spring and fall. Using a Structure from Motion algorithm, the aerial surveys provided 2 cm and 5 cm per pixel resolution for 2D and 3D digital models, respectively, to evaluate changes in channel geometry. The three streams were in relatively flat (1% to 1.5% slope) urban corridors with typical restrictions on the restoration area such as roads, sidewalks and bridges, with available floodplains of 30 m to 100 m. Plans were to increase the stream lengths 17% to 32%, but the actual (“as built”) lengths were only increased 7% to 12%. Similarly, the sinuosity was supposed to be increased 8% to 16%, but in reality increased only 4% to 8%.

The authors suggest that these reductions in actual complexity significantly limit the hydroecological benefits relative to the plans. Bank erosion was evident where the constructed channel geometry was substantially different than the planned one. A flood event on one stream before the vegetation could be established resulted in continuing bank erosion. Several ponds originally hydrologically connected to one stream were subsequently isolated after restoration, resulting in eutrophication, heavy reed growth and dry periods. The lack of shade was an issue on all restored streams, although some trees had been planted in places. The UAV surveys also detected construction activities that severely disturbed parts of the restoration work, as well as evidence of sewage spills resulting in heavy eutrophication in one stream. Nine restoration parameters were derived from the UAV surveys and helped identify stream reaches most in need of follow-up repair. Overall, the authors suggest that this relatively inexpensive system using UAV-derived data can be very useful in evaluating the success of stream restoration projects after completion.

Sometimes timing is everything in studying streams. In 1975 and 1978 there were cross-sectional surveys of the Powder River in the northern Great Plains of the United States.2 It is a perennial, meandering, free-flowing river subject to periodic flooding from naturally occurring events such a snow melt. In May 1978 there was the second largest known flood of about five times the bank full rate of 160 to 170 m3 s-1, followed by an invasion of non-native Russian olive (Eleagnus augustifolia) along the river. Because Russian olive forms much denser, stiffer stands than the native willows and cottonwoods, the effects on stream morphology were studied using subsequent surveys on land and by Light Detection and Radar (LiDAR) technology over a 90 km stretch of the river. With theoretically greater sediment trapping in the Russian olive stands, the authors hypothesized that the point bars would have lower slopes and higher elevations. It turned out the width of Russian olive stands did correlate well with decreased point bar slopes, but not with elevation. The authors consequently proposed that the point bar morphology controls the colonization by Russian olive, which is more likely to have seeds deposited and plants establish on less steep areas. A comparison of the ground survey elevations to that derived from the lidar data indicated that they correlated closely. The largest deviations between the two methods were where the slopes were steepest, such as on cut banks, but overall they matched well.

References:

  1. Langhammer, J., T. Lendzioch, and J. Solc. 2023. Use of UAV Monitoring to Identify Factors Limiting the Sustainability of Stream Restoration Projects. Hydrology 2023, 10, 48. https://doi.org/10.3390/hydrology10020048
  2. Moody, J. A. and D. M. Schook. 2022. Ecogeomorphic interactions of Russian olives (Elaeagnus angustifolia) and point-bar morphology along Powder River, Montana, USA. River Res Applic. 2023;39:1094–1109. DOI: 10.1002/rra.4139.


About the Expert
Rich McLaughlin, Ph.D., received a B.S. in natural resource management at Virginia Tech and studied soils and soil chemistry at Purdue University for his master’s degree and doctoral degree. He has retired after 30 years as a professor and extension specialist in the Crop and Soil Sciences Department at North Carolina State University, specializing in erosion, sediment and turbidity control. He remains involved with the department as professor emeritus.

Why Culture and Words Matter

One saying I often use is, “Words either wow or wound, so use them carefully!” People who are intentional and thoughtful about the words they use experience a cringe-like reflex immediately when using a word or words that shouldn’t have been used. We’ve all done it, and then we say to ourselves, “I knew I shouldn’t have said that as soon the words came out of my mouth!”

One example of the power of words and culture comes from a planning session with a group of company leaders and managers. A member of the group voiced concern that the company’s morale was at an all-time low, and the culture was in a state of degradation. The leader’s response was that he was “sick and tired of dealing with this soft stuff BS, and people just needed to do what they were paid to do.” The leader went on to say that culture didn’t make the company money or grow their bottom line, otherwise there would be a line item for culture on the profit and loss statement. The leader’s statements are the reason that I always say the bottleneck starts at the top.

What ensued was a heated exchange between team members, and the formation of two clear divisions amongst the ranks that the leader referred to as “the old guard” and “the new guard.” You can imagine what was going through my head as a first-time observer and facilitator of the group, as well as the minds and mouths of the team members. “Old guard versus new guard like in prison,” yelled one manager who was part of the “new guard,” which solicited a quick response from the one of the “old guards” who said, “Sort of… you gotta problem with that?”

I interjected and broke up the group into teams comprised of members from both new and old guard groups to address these issues and questions:

  1. Do we want to set up divisions and refer to one another as the old and new guards, or do we want to have a unified community and leverage the power of one? If so, what do we want to call ourselves and be known as?
  2. How should we define and describe our current company culture? Are we happy with what it represents and, if not, how do we want to change it?


After the exercise was completed and group responses presented, the entire group was asked, “Does culture matter?”

Spoiler alert, they agreed that culture mattered, and they weren’t happy with their current culture. They collaborated and came up with twelve activities that they could do as a team to strengthen their culture and agreed that they would focus on one activity each month to fortify their culture. They would reward and celebrate when cultural values were acted upon, and coach up when they were violated. They decided to call one another “allies” instead of old and new guards and defined an ally as a supportive and trustworthy partner in achieving common goals.

Words have power and really do matter in business and life. Whether words are used to help convey and clarify messages and reduce confusion, create a positive impression and build trust, motivate others to act or negotiate and de-escalate conflict to create harmony… words matter. Culture is the glue that keeps allies engaged and committed, attracts and retains like-minded allies, boosts productivity and creativity and fosters a supportive environment. Working as allies enhances the ability to adapt during tough times and promotes better decision making. A great culture can lead to increased profitability and long-term success, so perhaps culture should be a line item on your profit and loss statement. 

About the Expert
Judith M. Guido is the chairwoman and founder of Guido & Associates, a business management consulting firm in the erosion control and green industry. Guido can be reached at 818.800.0135 or judy@guidoassoc.com.

Effective Polymer Application to Dewater Sediment Ponds

Figure 1. Removal of a pipe from beneath this pond was necessary.

A site contractor has a three-fold objective:

  • Produce a quality product.
  • Finish the job on time.
  • Don’t lose your profit.

Difficult to do, but possible if unexpected problems do not arise. It is a safe bet that unexpected problems will present themselves, especially as the job approaches completion. Removing sediment from a pond is one of those problems that no contractor wants to address.

Sizing Up a Problem
Some construction sites do not have sediment pond management problems, at least not for a while. Soon enough though, the fine sediment seals the underlying soil pores, and infiltration is restricted.

Other sites have a lot of clay in the soil. These cohesive soils do not provide good infiltration. From the onset, they retain all of the inflow. As the water level approaches the maximum pond designed capacity, operators begin to wonder about dewatering them because contractors want to capture sediment, not to store water. Many pond systems include a dewatering device to achieve this goal. At the end, the contactor still faces a volume of soupy sediment that must be removed. Sediment in large ponds can be hydraulically dredged and piped to another area. Small ponds are more commonly treated with a polymer, which binds fine soil particles together, to change soupy sediment into a semisolid that is removed with mechanical equipment.

Four different options to address sediment pond management were used in the following construction projects in Georgia:

  1. The Hawthorne Project
    The Hawthorne Project pond (Figure 1) is one of several constructed to retain sediment on a new, large housing complex site. It was constructed over a buried water line. The sediment had to be removed from the pond before the water line could be removed. Grading was nearly complete, and the site plan did not identify any nearby location where the soupy sediment could be deposited when pumped out of the pond.
    An effective solution to this problem was to block the discharge from the pond. A backpack leaf blower distributed a mixture of polymer and sand over the surface of the sediment (Figure 2), and an excavator mixed the polymer into the sediment (Figure 3). After one more application and mixing, the sediment changed from a liquid to a semisolid that could be loaded and transported by the contractor’s earthmoving equipment. The mud was spread and allowed to dry.
  2. The Meadow Walk Project
    Construction was approaching completion at the Meadow Walk Project, and soupy sediment needed to be extracted from the pond to meet the designed volume criteria. An anionic powder polymer was mixed with sand into a bucket having holes in the bottom. An excavator was used to swing the bucket over the pond. The bucket was then used to incorporate the polymer/sand into the slurry. The treated sediment was transformed into a semisolid mass that was loaded and trucked from the site. This two-step process required only a few days to complete.
  3. The Parkway Point Project
    The turbidity of water in the pond at the Parkway Point Project exceeded the regulatory discharge standard. A shut-off valve was installed at the outlet control structure of this pond to stop discharge from entering a wetland. A simple closed-loop system withdrew water from the pond, passed it over blocks of polymer in a corrugated pipe and returned the polymer treated water back into the pond. Sediment settled in the stagnant pond. The surface water met the standard and was allowed to be discharged by a surface removal system.
  4. The Sixes Project
    Using a nearby source of electricity, a submersible pump lifted turbid water (Figure 4) and dropped it into a vertical pipe containing a block of polymer (Figure 5). The treated water was discharged back into the pond. One week later, the water was released (Figure 6). No maintenance was required.
Figure 5. Vertical pipe containing a block of polymer to treat turbid water.


Lesson Learned
On another construction site polymer-treated sediment was pumped into a filter bag. Instead of releasing the water, the bag retained the soupy sediment. It is thought that the polymer treated sediment clogged the bag pores and restricted water release. The pump pressure was so great that the bag quickly filled and the seams failed. Polymer-treated water flowed down the slope and into a stream. The lesson learned: When combining two or more BMPs, be sure to understand the interaction and limitations. 

[Editor’s Note: This is the third and final article in a series that addressed the use of polymers for erosion control on jobsites. Previous articles appeared in the third quarter 2023 and first quarter 2024 issues of Environmental Connection.]

Figure 6. Treated water is ready for discharge.


About the Expert
James W. Spotts, Ph.D., CPSS, CPESC, is president of Southeast Environmental Consultant LLC. His company assists contractors with environmental problems during construction. He also provides site inspections and NPDES discharge monitoring in the regional Atlanta area. Also known as “Dr. Dirt,” he is a long-time member of IECA and is passionate about teaching others how to solve field problems.

MOST POPULAR