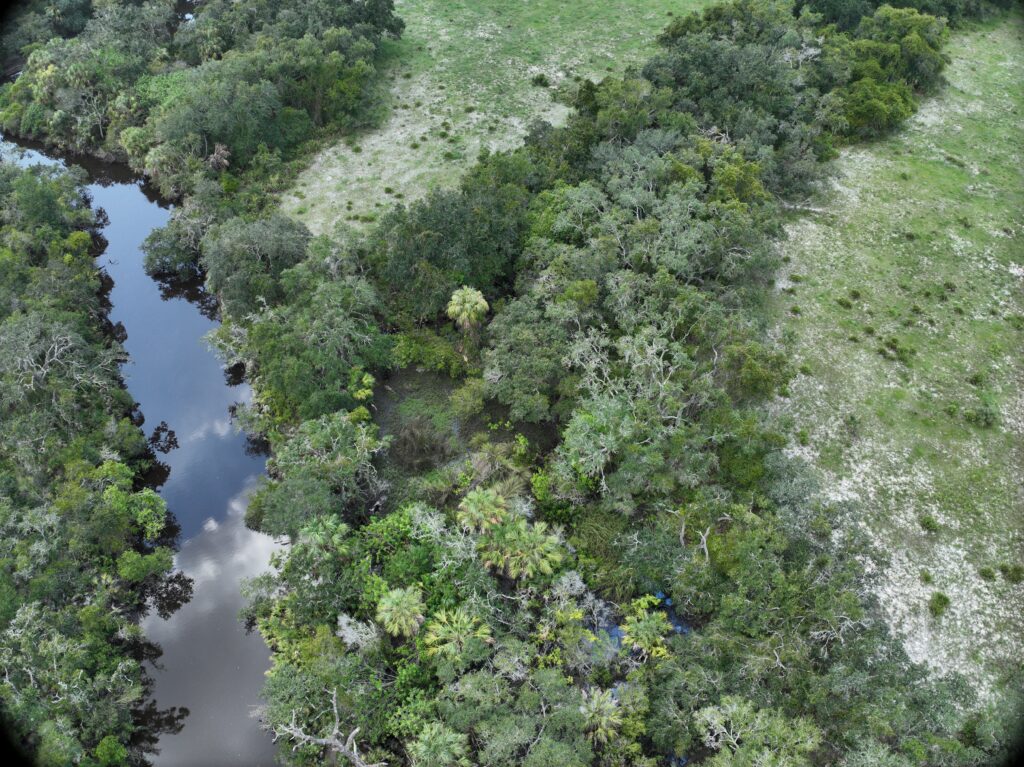
Figure 1. Confluence of two branches of the main lake tributary showing relatively cleaner water from an undisturbed forest area (left) and muddy water from a developed area (right). (Photo credit: Jeffrey D. Wilcox.)
It often takes a long time and a lot of data to begin to understand what is affecting water quality on a site or in a watershed. A recent study in the mountains of North Carolina, USA, used volunteers to obtain water samples over several years to estimate sediment loading to a 6,200 ac (2,509 ha) reservoir.1 The two main streams feeding the reservoir and the dam outlet were instrumented with water level gauges to estimate flows. Volunteers obtained close to 500 stream samples during and after storm events, including at the stream gauges. In addition, there were three high-frequency sampling events in which hourly samples were taken before, during and after storm events. Samples were measured for turbidity (in nephelometric turbidity units, or NTUs) and a subset for total suspended solids (TSS). A regression equation was calculated between turbidity and TSS to estimate TSS on samples that had only turbidity measured. Under base flow conditions, the water was relatively clear (1–20 NTUs), but it often exceeded 1,000 NTUs during storm events (Figure 1). The highest turbidity and TSS were usually just before and at the peak flow, with water clarity returning as flow subsided. Peak flows in the larger stream were in the 176–211 ft3/s (5–6 m3/s) range for three storms and 35 ft3/s (>1 m3/s) for 35 storms, with the highest flow in the other tributary at 78 ft3/s (2.2 m3/s). Estimated sediment loads to the reservoir from the two tributaries were 654–916 yd3/yr (500–700 m3/yr), with about 13% coming from the three largest storms. Coarse sediment could be seen deposited at the mouth of the streams (Figure 2), although much of the sediment was deposited throughout the lake. The homeowner’s association that owns the lake had recently had 920 m3/yr (1,200 yd3/yr) dredged from the lake, which the authors point out is less than two years of sediment accumulation. As a result of the study, they are considering installing forebays to help retain the sediment near the shore, where it would be easier to remove without lowering the lake level.
Figure 2. Sediment deposited in the lake at the stream inlet. (Photo credit: Jeffrey D. Wilcox.)
On a very different scale, runoff into road stormwater drains was monitored in Ohio, USA, to determine the particle sizes and sediment loads2 (Figure 3). Watersheds ranged from 0.025–0.45 ac (0.01–0.18 ha), and road types ranged from small state roads to high-speed interstates carrying 7,000–131,000 vehicles per day. The sites were monitored for 26–52 events, for a total of 490 events, and particle size distribution (PSD) and TSS were determined for a subset of these. The PSD was of interest in determining how well various stormwater control measures might work to remove sediment from road runoff. Rainfall durations were greater in fall and spring compared to summer, but intensities were greater in the summer. TSS concentrations averaged 35 mg/L over all sites, which was relatively low compared to data from other studies. Concentrations were not related to traffic volume or rainfall characteristics, which suggests other factors were involved. Sediment loads averaged 0.9–12 lb/ac (1–13 kg/ha) per storm event for the 11 sites, with annual loads ranging from 95–508 lb/ac/yr (107–569 kg/ha/yr). The PSD varied across sites but averaged around 4% clay, and the remainder was evenly divided between sand- and silt-size particles. The median particle size ranged from 24–72 µm (<400–200 mesh) and was influenced by nearby land use, with low-density residential areas having the largest particles. The two roads with the most traffic also had the smallest PSD, which suggests that particles were being pulverized during dry periods. Using published sediment capture rates for different stormwater control measures, the authors suggested that dry detention basins and wet pond/wetland devices could achieve an 80% reduction in sediment loads based on the PSDs in the study. Filter strips and swales may need to be paired with other measures to achieve similar removal rates.
Figure 2. Sediment deposited in the lake at the stream inlet. (Photo credit: Jeffrey D. Wilcox.)
References
Wilcox JD, Stark KA, Svetlov R. 2024. Estimating Stream Sediment Loads to Assess Management Options for a Southern Appalachian Mountain Lake. Environmental Earth Sciences 83:387.
Winston RJ, Witter JD, Tirpak RA. 2023. Measuring Sediment Loads and Particle Size Distribution in Road Runoff: Implications for Sediment Removal by Stormwater Control Measures. Science of the Total Environment 902:166071.
About the Expert Rich McLaughlin, Ph.D., received a B.S. in natural resource management at Virginia Tech and studied soils and soil chemistry at Purdue University for his master’s degree and doctoral degree. He has retired after 30 years as a professor and extension specializes in the Crop and Soil Sciences Department at North Carolina State University, specializing in erosion, sediment and turbidity control. He remains involved with the Department as professor emeritus.
I am writing this on the ninth day of the extreme fire events in Southern California, USA. We are in the bulls-eye of the wind and fire zone with our bags and cars packed, in case we are told to evacuate. The wind is howling, and we are all as prepared as we can be.
Natural disasters like wildfires, storms and unexpected challenges highlight vulnerabilities, but they also create opportunities to focus on priorities and efficiencies within and outside your company. For erosion control and stormwater professionals, challenges present a chance to refocus, rebuild, enhance core business practices and strengthen relationships in the industry and the communities we serve. These moments force us to examine our priorities and improve our high-yield activities. These steps ensure that our best practices truly are best practices and not outdated systems we haven’t changed in years due to complacency. It’s a chance to create and strengthen partnerships that make us more resilient.
The key is to stay calm and focused on what you can control during demanding times. Overcoming challenges begins by building proactive strategies, just as fire disaster preparedness starts with having solid infrastructures and maintaining reservoirs, irrigation systems and firebreaks that are essential to readiness when it counts.
You should continually be developing smart partnerships and making best practices better. Situations like fires, mudslides or flooding offer the opportunity to strengthen your team by forging partnerships with arborists, landscapers, irrigators and heavy equipment operators. These partnerships amplify efforts by addressing vegetation risks, enhancing soil and bank stability and promoting fire-resistant landscapes. Working collaboratively is vital. Alliances with local and state municipalities and utility leaders can help you with the necessary permits and protocols to assist in the efforts to maintain water flow to fire-ridden or drought-prone areas. These partnerships not only reduce vulnerability but also showcase the collective strength of the erosion control and stormwater industry.
Help educate the public. Offer your subject matter expertise and resources to help your customers and the community solve immediate problems and prevent future ones. Simple, actionable outreach — such as workshops on defensible spaces and guides on bank stabilization, stormwater management and fire-resistant planting — empowers communities to take preventative action. By positioning yourselves as educators, you enhance trust and strengthen the connection between our industry and the people we serve.
Recovery during challenges depends on fast actions, collaboration and communication. With fires, for example, deploying erosion control measures like hydromulching, sediment barriers and silt fences prevent secondary disasters such as mudslides and flooding. Partnerships with suppliers ensure rapid access to materials, while government agencies and recovery teams provide additional resources and support. Collaboration becomes even more important during recovery. Tree companies assist with debris removal, while irrigation specialists repair damaged systems to ensure future resilience. Landscapers and restoration experts can help revegetate fire-damaged areas with native species, which stabilizes soil and aids recovery. These alliances transform overwhelming challenges into manageable, impactful solutions. Disasters remind us of what truly matters, so focus on priorities: protecting people, land and livelihoods. They provide clarity on where to focus on maintaining infrastructure, strengthening partnerships and engaging communities. By aligning our goals and priorities, we emerge stronger as individuals, businesses and industry.
Tough times aren’t just challenges. They’re opportunities to lead, innovate and build a future that’s sustainable and resilient while protecting our communities and ensuring they thrive in adversity.
About the Expert Judith M. Guido is the chairwoman and founder of Guido & Associates, a business management consulting firm in the erosion control and green industry. Guido can be reached at 818.800.0135 or judy@guidoassoc.com.
Richmond, Virginia, USA, is a city with a rich and checkered history, from being the capital of the Confederacy during the American Civil War to being a frequent choice in lists of the best American cities in which to live. Richmond has worked hard in recent years to overcome its darker chapters. That effort is particularly evident in overcoming the history of the city’s combined sewer system, which for years polluted the city’s downstream neighborhoods, including the Fulton Hill neighborhood, during combined sewer overflow events.
What is a Combined Sewer? Richmond’s combined sewer system dates back more than 150 years to when urban storm drains were connected to the sanitary sewer system, a standard practice in older cities throughout Virginia and the rest of the United States. As the city grew, impervious areas that shed rainwater increased, and runoff from heavy rains flowing into the water treatment plants occasionally exceeded capacity. With nowhere to go, the excess slurry of rainwater and sewage passed untreated into the James River winding through downstream neighborhoods in a process called a combined sewer overflow (CSO).
Mitigation work to prevent CSOs started early in the 1980s, using a variety of techniques. More recently, these techniques have evolved to include green infrastructure. Green infrastructure seeks to disconnect urban runoff from the combined sewer using strategies like permeable technologies to infiltrate water into the soils and using trees and vegetation to consume water as part of the evapotranspiration process.
A Green Idea for Fulton The Greening Greater Fulton project was conceived by Innovate Fulton’s founder, Chuck D’Aprix, when he learned that Richmond’s Department of Public Utilities was working with the Alliance for the Chesapeake Bay to find a reliable partner to create a green street in the city. Green streets use green infrastructure within the public right-of-way to blend CSO mitigation and neighborhood beautification. Innovate Fulton’s mission is to revitalize the primary business corridor in Greater Fulton, so the organization was a natural fit for the project that would address the CSO issue as well as create “a sense of place and improve the aesthetics of a neighborhood that has long waited for such an opportunity,” according to D’Aprix.
The project team included the Alliance for the Chesapeake Bay, Innovate Fulton, Groundwork RVA, the City of Richmond’s Department of Public Utilities, design firm VHB, local artists and Exact Stormwater Management. A robust community engagement effort resulted in a concept that would not only reduce pollution entering the James River and Chesapeake Bay, but also beautify the neighborhood, mitigate urban heat island impacts, increase native wildlife habitat and create safer pedestrian access to the businesses in the neighborhood. After resident feedback was obtained, engineers began making plans for a green street project that spanned two city blocks and included hundreds of native plants and trees, multiple rain gardens, permeable pavement and public art.
Budgets and COVID With the design nearly completed and the project fully funded in 2020 by grants from the National Fish and Wildlife Foundation, Altria Group, Luck Foundation, City of Richmond Department of Public Utilities and Wetlands Watch, the COVID pandemic delayed the start of the project.
When the pandemic ended late in 2022, after many months of rampant inflation, building a project with an outdated budget proved nearly impossible. The project contractor worked with the design team to find ways to reduce costs while keeping the project goals intact. With support — and price concessions — from material suppliers, a final plan was nailed down and construction began in June 2024.
The Project Centerpiece Richmond’s Confederate-era statues were removed during civil unrest in the early 2020s, leaving many empty public spaces. The Fulton Green Street project continued the city’s efforts to replace them with a new kind of art that leverages the shared history of the city. A stormwater plaza located in the center of the green street project was designed to showcase art from Richmond’s local talent.
Artists worked with the neighborhood to create a sculpture to sit in the center of the plaza as a focal point for the project (Top photo). The nearly 12-foot (3.66-m) tall, 2,800- pound (1,270-kg) sculpture illustrates the water cycle, highlighting the importance of the stormwater management improvements implemented along and below the street. The artists used birds depicted in the sculpture to symbolize a healthy environment and tie the watershed improvements to the idea of neighborhood unity. The sculpture sits on a pedestal surrounded by 400 feet2 (36 m2) of decorative permeable pavers bound together by a central ring that includes the names of all the local neighborhoods, including Fulton.
Figure 1. The permeable pavers help retain water from the parking lots and rooftops and prevent it from entering the combined sewer system.
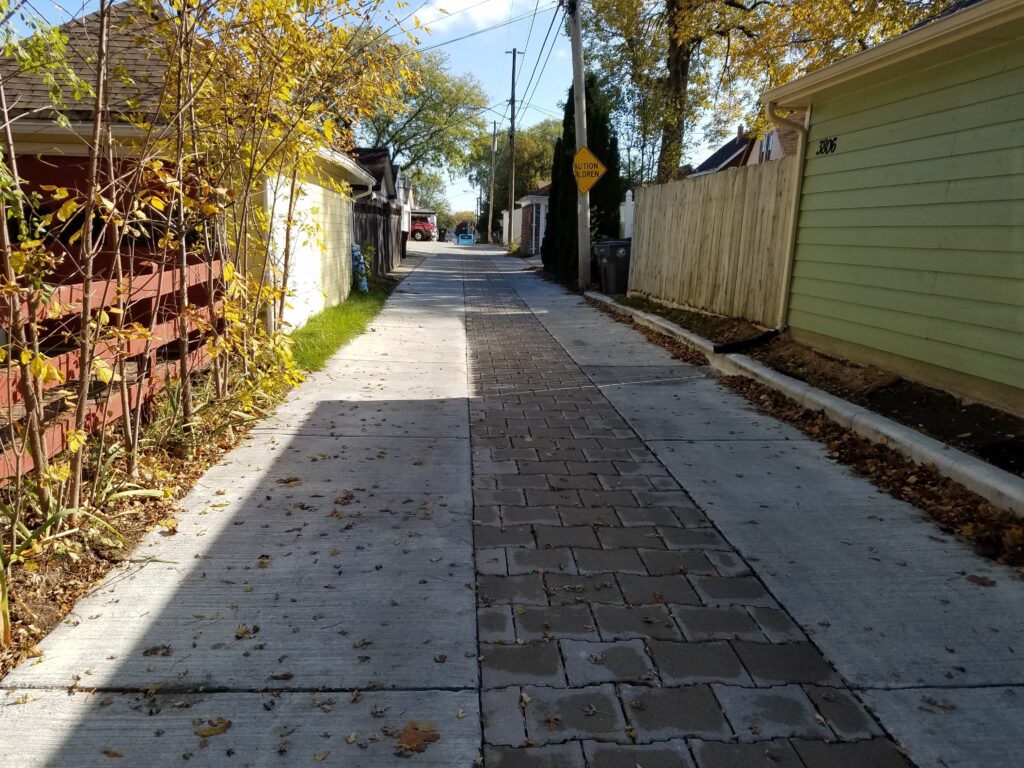
A Permeable Streetscape On the upper block above the plaza, a patched network of asphalt and concrete was removed to make way for permeable pavement (Figure 1). Placed adjacent to a new sidewalk in a long, straight stretch spanning nearly the entire block, the pavers collect runoff from rooftops and parking lots before it can get to the street’s combined sewer inlets.
Coordination with the existing businesses was critical. Between the foot traffic and the cars passing through to multiple storefronts, the pavement was done in sections to maintain access so businesses could stay operational. An open-joint permeable paver was selected to handle the high volume of traffic and facilitate future maintenance (Figure 2). Because open-joint pavers can be cleaned with vacuum trucks and don’t require joint filler to be reinstalled afterwards, concerns about future conflicts between maintenance workers and vehicular traffic were easily overcome.
Figure 2. The permeable paving blocks don’t require joint filler, which will lengthen the maintenance intervals and keep maintenance workers out of traffic.
Pavers, rain gardens and bioretention areas work independently to absorb and infiltrate the maximum amount of runoff possible, passing only the overflow volumes from larger storms back into the combined sewer. A small, elevated underdrain beneath the pavers collects excess runoff and carries it under the city street in a new 15-inch (0.38-m) concrete pipe installed as part of the project. This pipe continues down through the lower block, picking up the overflow volumes from other BMPs along the way, before connecting back into the city’s combined sewer.
At 9 feet (2.7 m) below finished grade, installing the new pipe proved to be the hardest part of the project (Figure 3). Working in a narrow corridor meant using a trench box to safely lay the pipe, and while most of the utility conflicts were in the street, there were a lot of smaller shallow connections to the businesses that had to be worked around.
Bioretention Prior to the project, the lower block contained only a few, small, dying street trees and more patchwork of asphalt and concrete — a typical picture of urban decay. Demolition proved challenging when some of the pavement was found to be more than a foot thick, but larger saw blades and bigger excavators were brought in to build three large bioretention areas that totaled nearly 600 feet2 (55 m2) to help retain runoff and create wildlife habitat (Figure 4). Runoff flows into the bioretention systems through curb cuts along the street, preventing it from reaching the combined sewer inlet.
Figure 3. A high flow rate biofilter used in a linear application in the Pacific Northwest United States.Figure 4. Three bioretention systems help reduce total flows into the combined sewer system by 17% during a one-year storm event.
The three rain gardens include over 500 plants, including several magnolia and fringe trees and numerous plant species such as physostegia, sweetspire, summersweet, inkberry and iris.
Fourteen distinct planting beds surround the bioretention areas, permeable pavement and the stormwater plaza to add majestic street trees and more than 600 plants. Between the two blocks, more than 1,100 plants were installed, creating an exciting new place to reignite neighborhood pride and bring new interest from potential residents and investors interested in commercial properties.
Conclusion The improvements to neighborhood aesthetics are matched by performance improvements, reducing flows to the combined sewer from the 10-year storm to 5.85 feet3 per second (cfs) (0.166 m3/s) from 8.85 cfs (0.25 m3/s), a reduction of nearly 35%. While the environmental improvements in one underserved community may pale in comparison to darker portions of the city’s history, it is another link in the chains of the past, broken and reforged into a brighter future. Innovate Fulton has noted that potential business owners and developers are looking at the business district and there is a renewed sense of hope thanks to a project rooted in environmental justice. Perhaps the project’s sculptor said it best, “We believe community improvement is best accomplished when we all do our own small part to lift up the community together.”
About the Expert
Corey Simonpietri is vice president of business development for EXACT Stormwater Management.
View the Project in Person
The Greening Greater Fulton project is one stop on an educational field tour offered at the 2025 IECA Annual Conference and Expo. Go to //ieca2025.eventscribe.net for information about all of the educational and networking opportunities at the conference.
Figure 1. Rain garden located in a high visibility area requires regular watering, mulching and maintenance to ensure growth of vegetation for aesthetics and for effective stormwater management.
Imagine walking onto a completed construction site. The grass is green; the structures are installed and fencing is in place around the stormwater basins. The contractor’s work is complete, and the Notice of Termination has been filed. Now what?
Stormwater management responsibilities do not end when construction ends, but it does change. Knowing how the site was designed and installed can have a significant impact on the success of the post-construction stormwater quality and the ongoing costs and timelines for the operation and maintenance of the post-construction best management practices (BMPs). Forward-thinking designs and a transition plan to move between construction and post-construction stormwater management ensure long-term success.
Planning for the Future After the grass grows, stormwater from a regulated site will be subject to ongoing inspections, analytical monitoring and permit-driven water quality criteria, such as being free of debris, odor and floating or settled solids. Post-construction BMPs may reduce discharge volumes, increase infiltration, filter out pollutants and/or direct flow to specific locations on-site, but only if they work as designed. Anticipated post-construction outcomes, operating requirements and maintenance needs should be incorporated into the design during construction planning. While there are initial costs and logistics to be considered during design and construction, there are also long-term considerations.
There are many questions to answer to ensure successful post-construction stormwater management. An owner may focus on how the site looks, but compliance and operations professionals need to also understand how post-construction controls work.
Transition to Post-construction During construction, the site changes daily. Exposed sediments may erode and be deposited in basins, inlets and outfalls. Construction materials such as packaging, paints, maintenance fluids and even erosion and sediment control BMPs such as silt fences and containment boxes can leave pollutant residue that have a lasting effect on post-construction stormwater quality. Once construction is complete, the post-construction controls should be clean, new and ready to handle the post-construction land uses.
To reduce cost and improve efficiency, select BMPs that can transition from construction to post-construction applications. For example, avoid swapping out structures such as using corrugated metal pipe (CMP) during construction and CMP during operations. Install the final product, then protect and maintain it during construction. Use temporary controls such as sediment traps and seeding to maintain design flow conditions with minimal transitional maintenance between construction to post-construction activities.
To aid in a smooth transition from construction to post-construction, focus on protecting post-construction BMPs during construction. Block orifices that are not needed during construction and stabilize drainage areas to post-construction inlets. Construction activities should also be sequenced so that a stabilized and completed area is avoided and thereby protected from damage by ongoing construction traffic and storage activities.
The long-term stabilization of a project is affected by proper seeding techniques, correct fertilizers/biotics incorporated in the soil, seed type, seed quality, armoring of the soils and irrigation. Review stabilization criteria in post-construction design plans to ensure the application of the correct materials to get a permanent stand of vegetation. For long-term maintenance, consider an irrigation system as part of the post-construction BMPs for the maintenance of permanent vegetation (Figure 1).
As part of the construction closeout, focus on more than just final stabilization. Removing sediment and other pollutants from the construction site is a key success factor for a good start to post-construction stormwater management. Post-construction controls are designed for anticipated final elevations, flow conditions and pollutant loads. During construction closeout, review as-built conditions to be sure they match design requirements, such as ensuring that the emergency spillway is in the correct location and is sized appropriately.
Longevity, Operation and Maintenance No material is invincible, so the life cycle of post-construction BMPs must be considered in the design phase. Creating a replacement schedule and critical path items for operation and maintenance can prolong the life and efficacy of post-construction BMPs. Remember that capital planning is required to replace critical infrastructure. Pavement and basins can become part of the landscape, literally, and are often overlooked in the planning process until something fails to function. Bringing stormwater infrastructure into the business planning cycle helps ensure that there is sufficient budget and lead time to perform updates and replacements.
Designed post-construction BMPs are intended to manage a specific volume of stormwater and pollutant load, so components, including pipe sizes, drainage areas, discharge features, depth, side slopes and filtration media are each calculated to meet the design criteria. Plant expansions, land use changes, changes in chemical use or manufacturing areas, plus variations in climate patterns may affect the operation of post-construction stormwater BMPs so continual monitoring of operational conditions is necessary to identify the need for updates or adjustments to the design.
Inspection and Maintenance A comprehensive inspection and corrective action process, along with a schedule for ongoing preventive maintenance will go a long way towards achieving effective stormwater management and extending the life of BMPs. Continual maintenance should include cleaning out accumulated sediments, repairing leaking valves, replacing filtration media and repairing broken elements of the treatment train. However, design plays a critical part in the maintenance plan. The original design should consider the following items to ensure a successful post-construction maintenance program:
Access Fences placed on the top of an embankment structure as a safety measure for pedestrians or mobile equipment can make it difficult for equipment to enter the area to maintain the inside of the pond if the fence is too close to the slope. Overly steep side slopes or unstable slopes in wet weather can further compromise access. Plan to provide a 10-foot to 15-foot (3.1-m to 4.60-m) buffer between fencing and infrastructure, especially along the corners of basins and pipe cleanouts. Provide a shallow side slope to allow equipment access. Provide ladders, steps and handrails to provide safe pedestrian access. Consider the placement and sizing of gates to provide enough room for the equipment to enter.
Access to the outfall is critical and commonly overlooked. The outfall is the point of compliance where monitoring of water quality is measured against permitted limits. Outfalls should be accessible and well maintained. Consider signage, armored walkways and sample structures that allow for safe and easy access for collecting water samples.
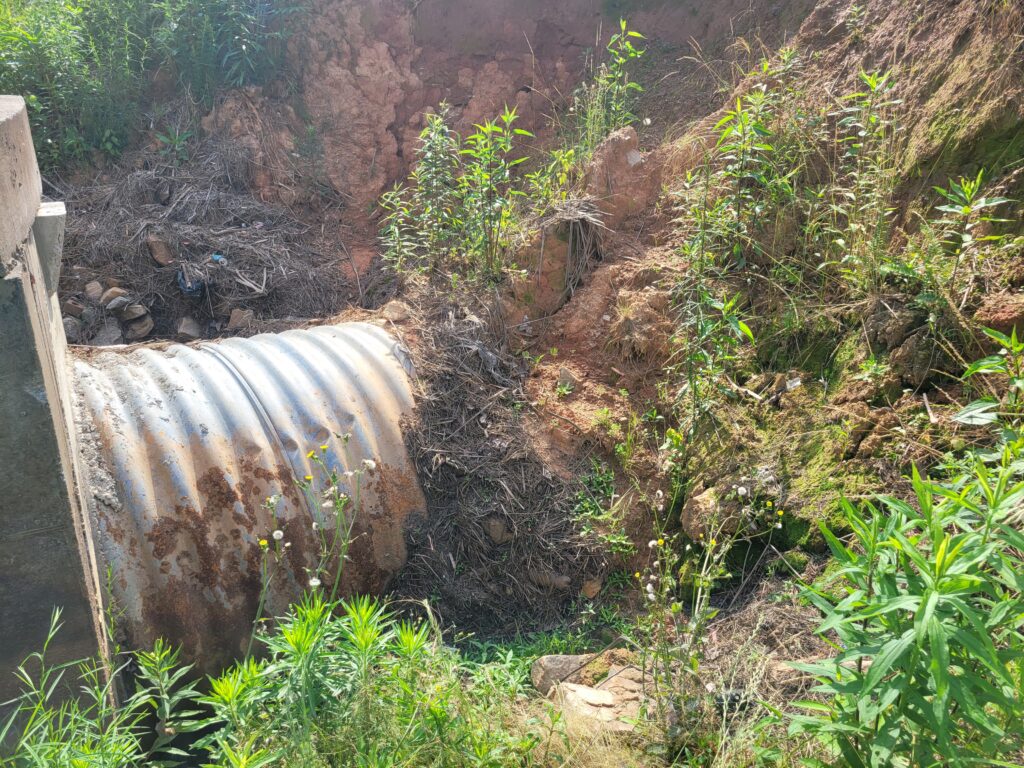
Durability Selecting the cheapest materials can turn into a long-term expense. Corrugated metal pipe corrodes in wet conditions leading to the need to be replaced or lined. Not only does the pipe need to be addressed, but typically the soils surrounding the pipe have eroded, causing voids and potential soil failures that affect other nearby structures, such as roads and fences (Figure 2).
Clogging and Cleaning When choosing a dewatering structure consider the cleanout methods necessary to maintain the structure. A single-wall corrugated plastic pipe under gravel used as an underdrain in a detention structure for dewatering can easily become clogged, crushed or damaged. Because they are embedded in the bottom of the basin, they are difficult to access and expensive and time consuming to replace or clean. Consider adding cleanout ports or finding an alternative dewatering method to avoid costly repairs.
Aesthetics Maintenance of items that are both functional and beautiful are often prioritized. Vegetative filters near the front entrance tend to get watered, mowed and maintained, while the outfall at the back end of the pond is overgrown and forgotten. Creative designs that enhance the aesthetics of all BMPs make access to all stormwater features practical and beautiful to encourage ongoing management.
Maintenance Frequency Selecting BMPs that can be easily and infrequently maintained will lead to better overall management. A good rule of thumb is to seek BMPs that require no more than quarterly to semi-annually (once every six months) can become too expensive to maintain and too easy to strike from a budget. Maintenance measures should be less expensive than a replacement during an enforcement action resulting from a failed post-construction BMP.
Figure 2. The bottom of a CMP barrel of a riser structure designed for post-construction use rusted, causing voids that allowed soils to enter the system and erode along the pipe.
Design criteria, performance and long-term operation and maintenance considerations go hand in hand in making the successful transition from construction stormwater management to post-construction management. A stormwater professional’s knowledge and understanding of how to protect and maintain the hard-won construction project to achieve post-construction stormwater objectives is critical to the success of the site.
About the Experts
Julie Morelli, PG, REM, CPESC, CESSWI, ENV SP, environmental compliance and regulatory manager at H-E-B, has been a stormwater professional for 25 years in the consulting industry. She has worked with stormwater and water quality issues in construction, industrial and municipal settings.
Susan Yates, CPESC, CESSWI, environmental compliance manager, Real Estate Department, Southeastern Freight Lines. She has been a stormwater professional for 25 years and has worked in regulatory, consulting and the private sector as an environmental and stormwater manager.
Figure 1. A timeline of the progression of artificial intelligence.
With the rapid proliferation and growth in the capability of artificial intelligence (AI)-based applications, many industries have begun to explore their use to streamline processes, increase production and simply ease the workload burden. It’s no surprise that the use of AI applications for environmental compliance tasks and documentation is also being explored. While the myriad of possibilities and benefits intrigues many of us, the use of AI for regulatory compliance work has the potential to expose the user to unforeseen risks. The rapid pace of AI development is not just a trend, but a transformative force that is reshaping industries, enhancing capabilities, and redefining the way we work. With advancements in AI, our industry is witnessing an era where developments occur in months rather than years.1 This is a momentous shift, akin to the early 1990s when the internet revolutionized the world. To fully appreciate the potential of incorporating AI into the development and implementation of stormwater and other environmental compliance documents, we first need to grasp the fundamentals of AI and its historical advancements. AI is a technology that encompasses the development of software and hardware designed to simulate human functions such as completing tasks, learning and comprehension, problem-solving, decision-making and more.
The Evolution of AI The early history of AI began in 1946 with the introduction of the first digital computer, ENIAC. Shortly after, Alan Turing, who is often considered as the father of modern computer science, appeared well beyond his time when he began exploring the future possibilities of computer science with his creation of the imitation test, or what is known today as the Turing Test. The Turing Test was a pivotal concept in AI because the purpose of the test is to identify whether a machine, or AI, is capable of exhibiting human-like intelligence. Progress in the field continued into the early 1970s, marked by new innovations and the Dartmouth AI Conference, which helped establish what is now the Association for the Advancement of Artificial Intelligence. However, between 1974 and 1980, a period known as the “AI Winter” occurred. During this time advancements stalled due to the limitations of existing technology. Claims that the AI industry was overpromising and underdelivering and not living up to the hype led to a decreased interest in the subject and lack of funding necessary to continue the advancements in computer technology needed to further progress AI research and developments.
Since the 1980s, the landscape of AI has not only thawed but accelerated rapidly, driven largely by significant increases in computational power, leading us into the current AI revolution2 (Figure 1).
One of the most impactful forces behind the AI revolution is the ability to continuously miniaturize computer chips while simultaneously packing more power and efficiency into each tiny chip. This progress has dramatically increased computational power while simultaneously reducing the size of devices.
As a result, the available format of computers has transitioned from room-sized computers to the small device currently residing in your pocket, all while lowering costs of such devices. These hardware advancements, combined with cutting-edge software developments and machine learning algorithms, have made the creation of today’s AI systems possible. Take the convergence of powerful, affordable computer technology, add the currently available more sophisticated algorithms, and, in the fashion of Diablo II, put those in your Horadric Cube and transmute them. Or for those readers not familiar with retro video game terminology: When combined it is greater than the sum of its parts. The resulting product is today’s transformative AI applications.
Today, AI exists in three main forms: narrow AI, general AI and super AI. Narrow AI performs specific tasks like virtual assistants, spell checkers and recommendation algorithms. General AI, which aims to replicate human cognitive abilities, and super AI, which would exceed human intelligence, are both theoretical. Each type has distinct implications for integration into stormwater and environmental compliance documentation.
Figure 2. Use of deep learning for image identification in imagery captured by UAVs can enhance site analysis.
AI for Documentation Today While general AI and super AI remain theoretical concepts, how can narrow AI be practically applied to our industry and job functions today? Generally, AI has already been quietly integrated into daily tasks. Many people use search engines to research stormwater and environmental compliance regulations in unfamiliar jurisdictions or states. These search engines are leveraging AI to deliver relevant results by processing billions of searches per day and learning from those previous searches. AI also powers the review functions in word processing programs that check for grammar, clarity and vocabulary and suggest improvements through synonyms and concise language choices. These functions already help professionals in the industry prepare stormwater pollution prevention plans, environmental management plans and other compliance reports.
But what about more complex applications of narrow AI? AI-powered tools that incorporate machine learning and generative AI present advantages in simplifying and expediting the development and review of environmental compliance documents. By leveraging sophisticated algorithms, these tools can analyze large volumes of data, including site characteristics, regulatory requirements and historical compliance records. This analysis enables the automated generation of a comprehensive and customized list that accounts for applicable regulations and codes.
Recent advancements in vegetation management feature the use of deep learning for image identification, which is a type of machine learning, in imagery captured from unmanned aerial vehicles (Figure 2). This technology enhances our ability to assess environmental characteristics during site analysis,3 enables monitoring of sensitive resources4 and supports informed decision-making for final stabilization determination. AI image recognition tools must be trained not only to recognize vegetation but also to recognize best management practices such as mulch, silt fence and aggregates. This enables users to capture accurate stormwater inspection data, identify corrective actions and produce redline drawings much more quickly and safely than traditional methods with minimal post-processing of data.5
Three-dimensional civil design programs integrated with AI are helping engineers optimize grading designs and determine stormwater management designs with more precision. Weather prediction modeling that goes beyond “next week’s forecast” by using AI to facilitate faster data processing increases the feasibility of risk analysis based on the siting and timing of a project as well as the probability of extreme weather events such as droughts and hurricanes. This in turn can also allow projects to better plan erosion control designs and dedicate resources in preparation for such events, which reduces the risk of environmental noncompliance.
Custom generative AI models allow users to build, fine-tune or deploy their own models for specific use cases. A user can use existing pre-trained models such as large language models or image generation models and customize them for a task by training them on a specific data set. When it comes to developing environmental compliance documents, customized generative AI platforms enable the user to make quick determinations of applicable compliance regulations and rules. While accounts of private companies within the environmental compliance and construction industry indicate that developments of environmental compliance — focused AI applications are on the horizon, these currently remain experimental and proprietary.
By training a model on a specific data set, not only can users drastically decrease the amount of time spent researching, but can also reduce erroneous errors that may be present when using a broad-spectrum generative AI platform that pulls from non-specified data sets. Imagine the benefits of having an AI model that is trained in all the current state-specific construction general permits. With the right prompts, which is any form of text, question, information or coding that communicates to AI what response the user is looking for, producing stormwater design and compliance documents — saving time and ensuring accuracy.
Editor’s Note: This is the first of a two-part series. The second part of this series will appear in a future issue and will dive deeper into ongoing developments, future applications, challenges and risks of AI.
References:
Roser M. (2024) The brief history of artificial intelligence: The world has changed fast — what might be next?, Our World in Data. Available at: https://ourworldindata.org/brief-history-of-ai (Accessed: 2024).
The history of AI: A Timeline of Artificial Intelligence (2024) Coursera. Available at: https://www.coursera.org/articles/history-of-ai (Accessed: 2024).
James K, Bradshaw K. (2020) Detecting plant species in the field with deep learning and drone technology, Brittish Ecological Society. Available at: https://besjournals.onlinelibrary.wiley.com/doi/10.1111/2041-210X.13473 (Accessed: 2024).
Buchelt A, Adrowitzer A, Kieseberg P, Gollob C, Nothdurft A, Eresheim S, Tschiatschek S, Stampfer K, Holzinger A. (2023) Exploring artificial intelligence for applications of drones in forest ecology and management, Forest Ecology and Management, Science Direct. Available at: https://www.sciencedirect.com/science/article/pii/S0378112723007648?via%3Dihub (Accessed: 2024).
Kazaz B, Poddar S, Arabi S, Perez MA, Sharma A, Whitman JB. (2021) Deep Learning-Based Object Detection for Unmanned Aerial Systems (UASs)-Based Inspections of Construction Stormwater Practices. Available at: https://doi.org/10.3390/s21082834 (Accessed: 2024).
About the Experts
John England is a lead environmental scientist for Black & Veatch’s Construction Stormwater and Environmental Compliance practice. He provides environmental support and input during proposal and project development, including implementing and managing overall environmental compliance efforts during construction.
Kayla Cottingham leads the Construction Stormwater and Environmental Compliance practice at Black & Veatch. She leads the team’s environmental support and input during proposal and project development, including implementing and managing overall environmental compliance efforts during construction.
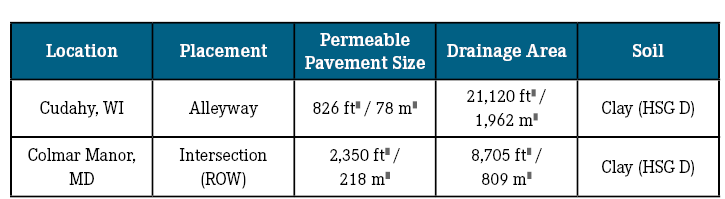
Figure 1. Colman Manor, Maryland, USA intersection with P-ACB.
Communities across the nation are faced with growing pressures to better address the persistent challenge of urban stormwater. Permeable pavement was developed to overcome this fundamental challenge by mimicking natural infiltration processes. However, rapid clogging of first-generation permeable pavements limited performance by preventing water from reaching the stone bases. In response to the clogging challenge, regulatory agencies have limited applications, imposed engineering redundancies and restricted crediting for permeable pavement.
Permeable articulating concrete block (P-ACB) pavements are next-generation permeable surfaces, developed by adapting an erosion control system into the pavement. P-ACB systems differ from traditional permeable pavers because they have open joints and use their large, interlocking pattern to handle heavy traffic loads. The open joints of this system allow it to handle more rainwater and make it easier to maintain because the cleaning process is required less frequently and is easier to perform. The suitability to handle heavy traffic loads enables P-ACBs to be used in all applications like roadways, traffic aisles and truck stops. Case Studies
Figure 2. Second generation floc generator in-line mixer embedded in a 12-inch PVC pipe. Electric current passes across metal plates as water flows through causing pollutants to drop out of suspension.
The use of P-ACBs in two locations has proven to effectively handle stormwater and reduce the maintenance needs of the pavement. Colmar Manor, Maryland, USA is located in a low-lying area with a high degree of impervious cover, poor drainage and pluvial flooding. The Maryland Department of Transportation approved using the PaveDrain P-ACB system in the public right-of-way for an asphalt traffic intersection that faced frequent stormwater challenges (Figure 1).
The State of Maryland’s guidance manual does not permit run-on or the use of permeable pavement on D (clay) soil. Because the town was familiar with the P-ACB product, the municipality accepted responsibility for the performance and maintenance of the site to allow for its construction. The as-designed drainage area was expected to be 8,705 feet2 (809 m2) but was found to be 10% larger: 9,400 feet2 (873 m2). Third-party soil testing was conducted during construction showing the presence of A (high infiltrating soil), B and D soils. In Cudahy, Wisconsin, USA, the PaveDrain P-ACB product is installed in a shared alleyway. The system is sized to fit inside the wheel path of traditional garbage collection vehicles to minimize truck traffic loading (Figure 3). The city requested this design although it is not necessary for systems rated to HS-25.
Wisconsin Department of Natural Resources (WDNR) limits run-on to 5:1 (permeable pavements may not drain more than five times their surface area). The actual run-on area was approximately 25 times the permeable surface constructed in the alley. The extreme run-on area was a perfect opportunity to use a P-ACB system given its very high surface infiltration rates. At this site, clay (D) soil was found during preliminary site investigations and the system design assumed very poor exfiltration characteristics. This resulted in the system using a relatively deep, 3-feet (91-cm) storage gallery and a 6-inch (15-cm) diameter underdrain kept just off the bottom of the gallery, open and draining to the downstream inlet structure.
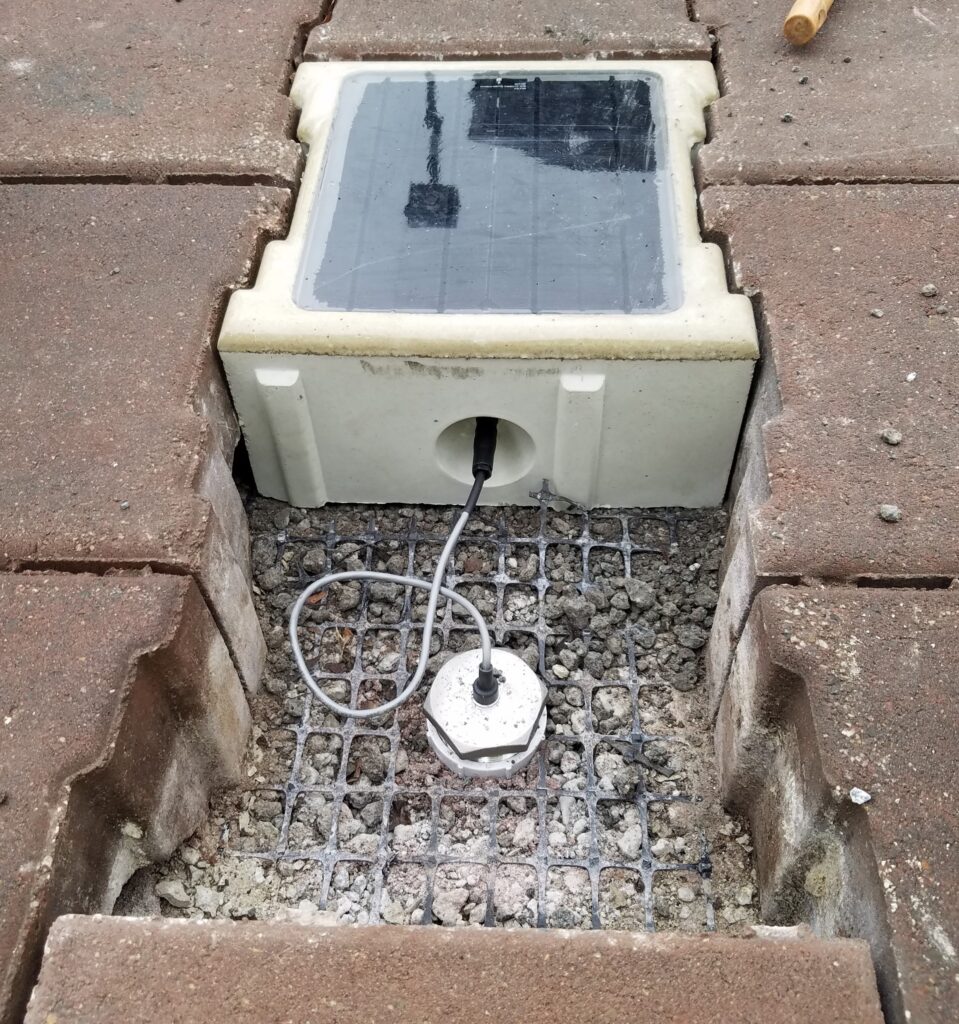
Both locations use in-situ real-time sensors (Figure 4). The sensors were installed in the aggregate storage galleries to measure water levels. At each location, the water level sensor is accompanied by a nearby weather station (Figure 5) monitoring rainfall, temperature, barometric pressure and relative humidity. During a storm, water enters the base quickly and exfiltrates from the stone base into the subgrade over time. Sensors document the movement of water to verify the system’s performance. All underdrains were converted hydraulically to overdrains by adding vertical standpipes at discharge locations thereby raising discharge elevations. No overflow events were observed during the measurement periods.
Figure 3. Description of PaveDrain P-ACB sites.
Observed Performance
At both sites, the systems captured all run-on and infiltrated almost all of the rainfall events within 48 hours. Fully capturing and infiltrating rainfall removes all nitrogen, phosphorous and total suspended solids that are mobilized over the drainage area.
Data from the Cudahy site was analyzed by P4 Infrastructure staff and presented to WDNR who accepted their findings.1,2 The Colmar Manor site was studied by the University of Maryland as an independent third party.3
The median exfiltration rates over 48 hours exceeded expected rates by 5x–10x (Figure 6). The peak exfiltration rates with high hydrostatic head pressure exceeded 5 inches per hour, which exceeded expectations. The average exfiltration rate over the first 48 hours is 0.99 inches (2.51 cm) per hour. For most jurisdictions, stormwater designs would expect clay soil to infiltrate at 0.18 inches (0.46 cm) per hour or less, nearly a full order of magnitude less than the rates measured in the field.
The discrepancy between observed and expected values is attributable to the heterogeneous nature of the soil and hydrostatic head. While clay soil is present, so are more permeable soils that form three-dimensional networks and paths for water to exit the stone base, which leads to elevated performance. Academically-determined data with a homogenous soil does not reflect real conditions over large surface areas. The peak infiltration rates are provided to help elucidate the effect of hydrostatic head.
In the three years since it was installed in Colmar Manor, the system has been functioning as a roadway and stormwater BMP without maintenance, which represents a commitment to environmental justice in this economically disadvantaged neighborhood.
Because of the additional credit provided by these single BMPs and verified by the sensors, both jurisdictions sought and were provided real credit for their site above their relevant design manual. The Wisconsin site showed that BMP area footprints can be reduced by up to 88% when using P-ACB systems with instrumentation.
Prince George’s County took credit for the sensor-verified environmental site design value of 1504 feet3 (42.6 m3) versus the guidance manual value of 376 ft3 (10.6 m3). Conclusion
Figure 6. Expected, median and peak exfiltration rates for each P-ACB site.
Designing BMPs that have substantially delayed clogging cycles allows the infiltration process to proceed. In some cases, design manuals have applied overly conservative engineering design factors to permeable pavements that have failed to account for the development of innovative systems. Sensor systems have shown a clear difference between desktop-modeled design and field-measured performance in the next generation of permeable pavement, and they should be incorporated until regulations are able to reflect real performance.
References
Weik T. 2021. Green Infrastructure Planning and Implementation Recommendations within the Total Daily Maximum Load Watershed. CBC Engineers.
Diekfuss J, Foley C. 2022. Permeable Pavement Systems Clean Water Faster and for Less Money. P4 Infrastructure.
Butters S, Davis AP. 2023. Evaluating Performance of PaveDrain Permeable Pavements in Colmar Manor, MD. University of Maryland.
About the Experts
Aaron Fisher, Ph.D., PMP, receive his doctorate in chemical engineering from the University of Maryland and a bachelor’s degree in chemistry from Duke University. He is the vice president of business development at Ernest Maier.
Joseph Diekfuss, Ph.D., PE, is a civil engineer with 15 years of experience. He is co-founder and vice president of P4 Infrastructure. He is a licensed Professional Engineer in Wisconsin, USA, a National Highway Institute Certified Bridge Inspector and first-named inventor on three United States patents in the area of civil engineering.
Figure 1. First generation full-scale self-contained portable floc generator used for full-scale testing.
Stormwater runoff is a leading source of water quality impairment in the United States. The most common pollutants carried by stormwater include sediment, pathogens, nutrients and metals. These pollutants are often found in runoff from construction sites and urban and agricultural lands. The goals of the Clean Water Act, established 52 years ago, remain unmet as current best management practices struggle to keep pace.
Phase I In July 2023, Fagan Consulting LLC and Auburn University received a Phase I contract with the U.S. Department of Transportation (DOT) through the DOT’s Small Business Innovation Research (SBIR) program to develop a self-contained portable stormwater treatment device. Over the following six months, the Fagan-Auburn team worked to demonstrate the innovation’s technical merit, feasibility and commercial potential. The project later received a non-dilutive supplemental grant from Innovate Alabama that deemed the team’s proposed approach “viable, valuable and scalable.” Innovate Alabama, a public-private partnership, promotes entrepreneurship, technology and innovation across the state.
By early 2024, the team had developed and tested a working lab-scale prototype, secured provisional patent protection and developed an initial commercialization and marketing plan. Supplemental funding from Innovate Alabama enabled the team to develop a full-scale working prototype and continue research and development beyond the goals of the SBIR contract.
The innovative device uses electrical flocculation, or electroflocculation, to bind up pollutant particles suspended in stormwater runoff. This method is based on the established application of electrocoagulation techniques used in water and wastewater treatment. Electrical flocculation works by passing electric current across metal plates as water flows between. The current causes positively and negatively charged ions to be released into the polluted water. The ions bind with pollutant particles with opposite charges to form larger particles. Accelerated settling and removal of these electrically neutral bound particles, or flocs, takes place as their size and density increases. This process is similar to chemical flocculation but eliminates the need for chemical polymers or other reagents.
The treatment device, called an electric floc generator, operates using a 12-volt solar-powered renewable energy source. It functions as self-contained and portable or as installed at a fixed location with an external power source. While direct current is the primary operating current type, alternating current can be accommodated using a power converter.
In terms of size and portability, the original full-scale prototype has a rectangular shape with a replaceable electrode cartridge in the center of the device. The housing for the initial floc generator (Figure 1) prototype was 3D-printed and is approximately 8 inches x 8 inches x 19 inches (20.3 cm x 20.3 cm x 48.3 cm). It weighs less than 15 pounds (6.8 kg). This model was designed to be connected to a sediment basin surface outlet structure with in-line mixing and floc settling downgradient. The device is easily transported using the built in handle. The team has initially focused on addressing TSS and turbidity with the floc generator. Construction stormwater runoff was the first target due to sediment being one of the more difficult stormwater pollutants to treat, and because of the Fagan-Auburn team’s extensive past work and expertise in managing construction stormwater. Initial testing showed that the turbidity of “treated” construction stormwater (after pretreatment using a sediment basin and surface outlet structure) was reduced by over 70%.
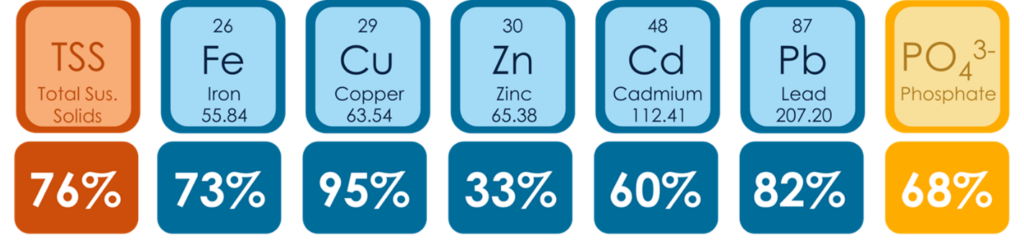
The floc generator can be easily adjusted to remove a range of pollutants from stormwater runoff in both construction and post-construction environments. It can also be scaled to treat larger flows or pollutant loads. Preliminary large-scale testing has shown effective reductions in total suspended solids, metals and nutrients (Figure 2). Preliminary spectrophotometry tests revealed that, even under worst-case scenarios, dissolved aluminum concentrations in water treated with the floc generator were below drinking water standards. As the device reaches the final stages of prototyping, additional toxicity tests, including bioassays, will be performed to ensure all toxicity concerns are thoroughly addressed.
Figure 2. Preliminary electrical flocculation treatment results for typical pollutants found in stormwater runoff.
Phase II The Fagan-Auburn team recently received a two-year Phase II contract from the U.S. DOT and secured another round of supplemental funding from Innovate Alabama. The objectives of Phase II include continued research and development, product demonstration and delivery to the commercial market.
Future research and development will be driven by established product specification goals. Goal areas include safety, portability, installation, operation and maintenance, modularity and expandability, ruggedness, automation and remote monitoring, pollutant types and loading, and flow rate accommodation.
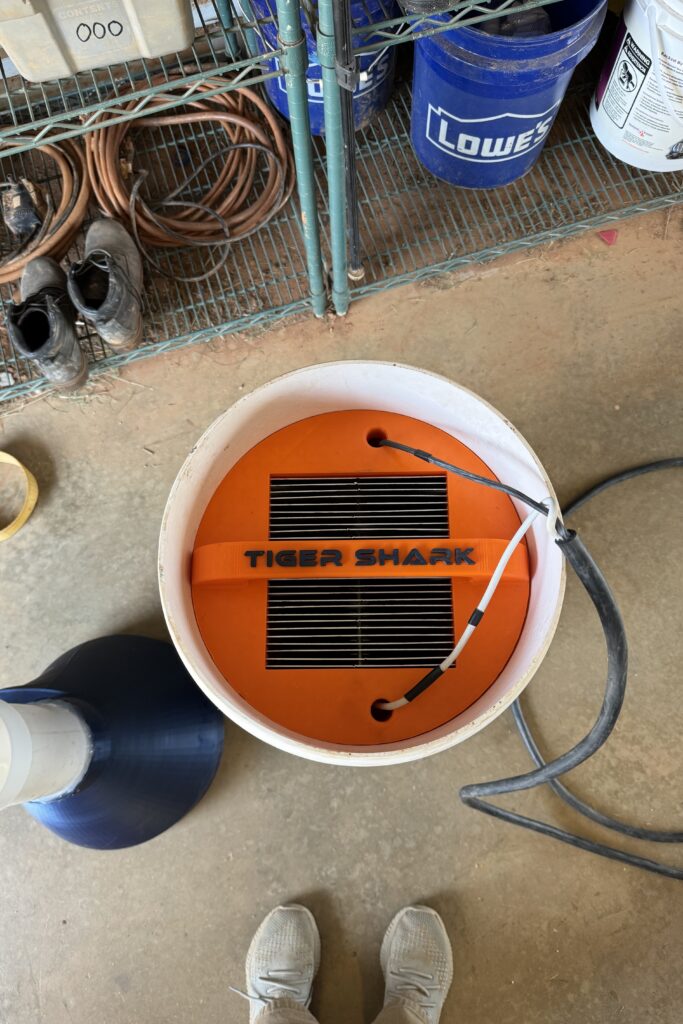
The next generation of the floc generator will have the ability to float inside a sediment basin or detention pond and pull water through itself for treatment. Mixing will take place inside the device, and settling will take place in the basin or pond. This model is nicknamed “Tiger Shark” and will optimize the space, shape and availability of a PVC pipe as the housing (Figure 3). In-line prototypes will be further optimized and evaluated for discharge occurring into a vegetated buffer or swale. Additional configurations will be developed in Phase II to adapt to various construction and post-construction applications.
Figure 3. Second generation floc generator in-line mixer embedded in a 12-inch PVC pipe. Electric current passes across metal plates as water flows through causing pollutants to drop out of suspension.
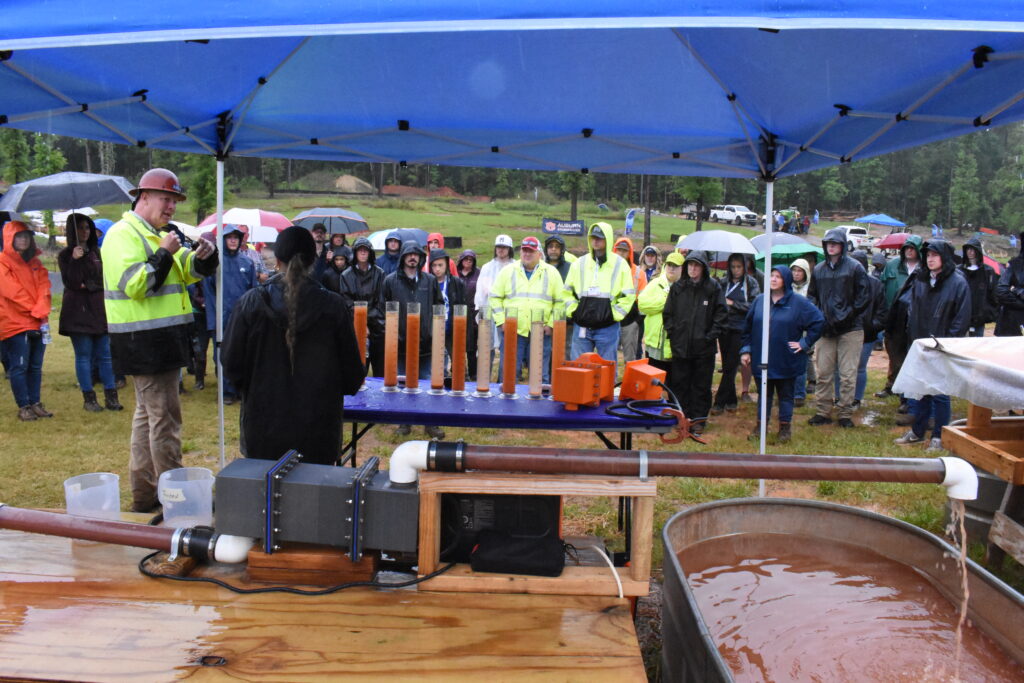
Crowdsourcing Members of the Fagan-Auburn team have developed a network of stormwater professionals and contacts as they have demonstrated the floc generator to a variety of audiences including Clear Water Alabama Conference and Installer Training and Field Day Events at Auburn University (Figure 4). The team is hoping to leverage ideas presented by the stormwater community to discover new application possibilities and for assistance with demonstration and field-testing sites. The team is also interested in learning about general concerns related to the concept of electrical flocculation in stormwater treatment and encourages people to reach out to the authors to learn more or offer suggestions.
Figure 4. Demonstration of the floc generator to stormwater regulators, designers, inspectors and contractors from across the southeast U.S. at the Auburn University Stormwater Research Facility’s annual Installer Training and Field Day events in May 2024.
About the Experts
Barry Fagan, PE/PLS, ENV SP, CPESC, CPMSM, is the principal investigator for the floc generator development project and co-owner of Fagan Consulting LLC.
Megan Armstrong, EI, is an engineering intern with Fagan Consulting LLC and a Ph.D. student at Auburn University. Her research on the project will serve as her Ph.D. thesis.
Michael A. Perez, Ph.D., CPESC, is an associate professor in the Department of Civil and Environmental Engineering at Auburn University.
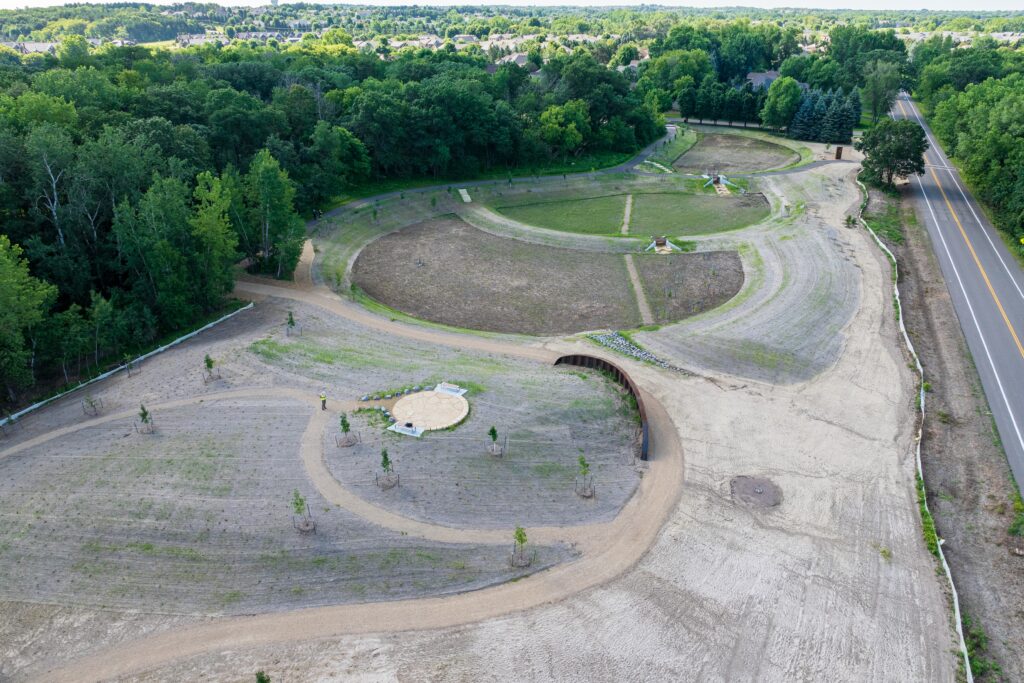
Figure 1. Overview of Hasenbank Park and lakes with Fish Lake on the left and Powers Lake on the right of the park.
When a suburban wetland complex threatened the water quality of a nearby lake and an undeveloped area between the two bodies of water, a team of engineers, landscape architects and the watershed district worked together to create a solution. The result is a beautiful park that cleans the water using soil infiltration and native plants and educates visitors with public art that explains the importance of stormwater treatment.
Fish Lake sits 20 feet (6.1 m) higher than Powers Lake in the City of Woodbury, an eastern suburb in the Minneapolis–Saint Paul metropolitan area of Minnesota, USA. During residential development between 2000 and 2006, the two lakes were connected by a pipe buried next to a 61-acre, city-owned undeveloped park space between the lakes (Figure 1).
The Challenge Fish Lake, a wetland complex, receives nutrient-rich runoff from nearby developments, which then flows into Powers Lake. Powers Lake has historically been quite clean and clear for an urban lake, but since its connection with Fish Lake, the addition of runoff high in phosphorus threatens water quality and increases the likelihood of nuisance algal blooms. In 2021, the South Washington Watershed District (SWWD) commissioned Barr Engineering Co. to conduct a feasibility study to determine best management practices that could preserve the high water quality in Powers Lake. Following a series of design phases, Hasenbank Park was constructed in 2023–2024, and habitat restoration will continue through 2026.
The Objectives The feasibility study resulted in a decision to create a park centered around water quality treatment and pump runoff from Fish Lake into a series of three rain gardens before it flows into Powers Lake. The rain gardens filter pollutants from the surrounding residential developments before they reach Powers Lake.
Several factors contributed to the ultimate project design. The project team, along with the SWWD and the city, wanted to determine the most cost-effective solution. They considered what pumps and storage would be needed for various storm events and how to integrate native plants and artwork to make the park appealing to the public.
The team focused on a central theme: Make the engineered elements (pipes and structures) visible to invite public curiosity and create opportunities for stormwater education. The goals of the new park were to protect lake water quality, nurture restored native habitat and use native plantings to control erosion and reduce nutrient loads to Powers Lake. To accomplish these objectives, the space needed to be beautiful, interesting, functional and environmentally sustainable.
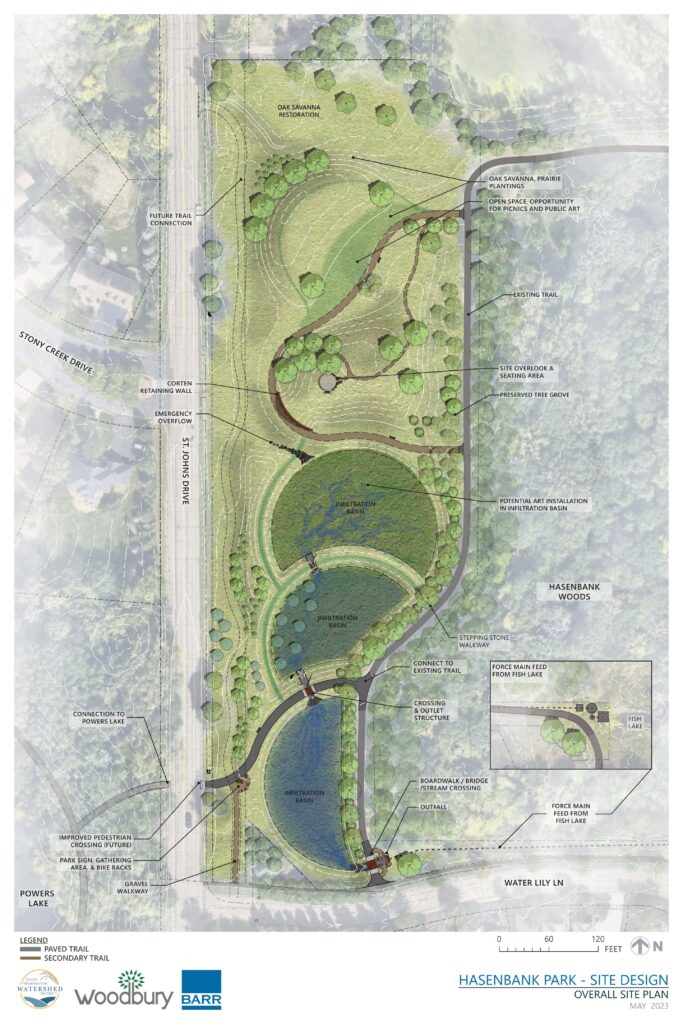
Figure 2. Hasenbank Park site design.
The Solution The first step in design (Figure 2) was to determine the most efficient way to get water to the park. Engineers developed stormwater models to determine appropriate pipe sizes and scale of the site and selected adjustable pumps that could be optimized after construction. Two pumps capture both low and high flows from the wetland. A stone spillway provides a view of the pumped water, giving visitors the first glimpse of the water treatment process.
The water flows into a series of three rain gardens designed to hold nearly 550,000 gallons (2,082,000 L) of overflow from Fish Lake. The soil and native plants in the rain gardens clean the water by filtering out pollutants before it flows into Powers Lake. Weir structures separate each rain garden, filling water to a certain level and then spilling into the next basin. Once the third rain garden is full, the pump turns off automatically. Each rain garden also has its own underdrain with structures that allow the city to optimize water levels depending on soil infiltration rates.
Figure 3. Hasenbank Park with the three rain gardens at the top and the hill with a retaining wall and overlook at the bottom of the photo.
Engineers and landscape architects worked together to design the project. The landscape architecture team selected native plants for the rain gardens, suggesting those that could survive based on the amount of water each rain garden was likely to get. The landscape architects also planned the park with public use and sustainability in mind. For example, the grading was designed to create a hill within the park constructed from the soil excavated from the rain gardens rather than hauling the soil away. The hill has a retaining wall on one side with an interpretive installation demonstrating the depth of the root system of the site’s restored oak savanna. The hill also serves as an overlook for park visitors (Figure 3).
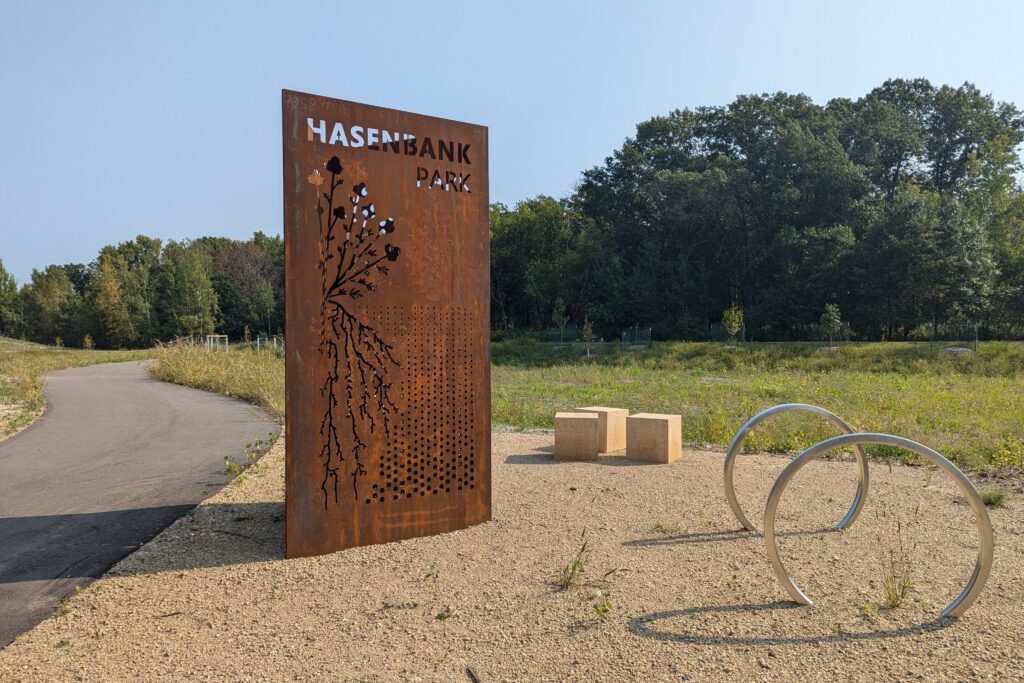
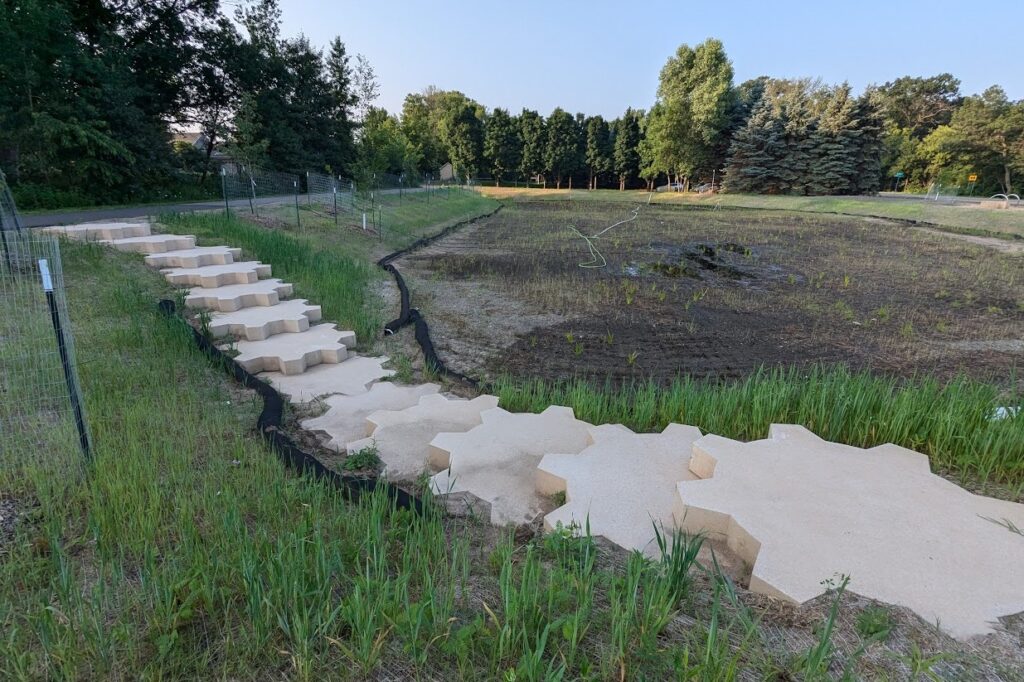
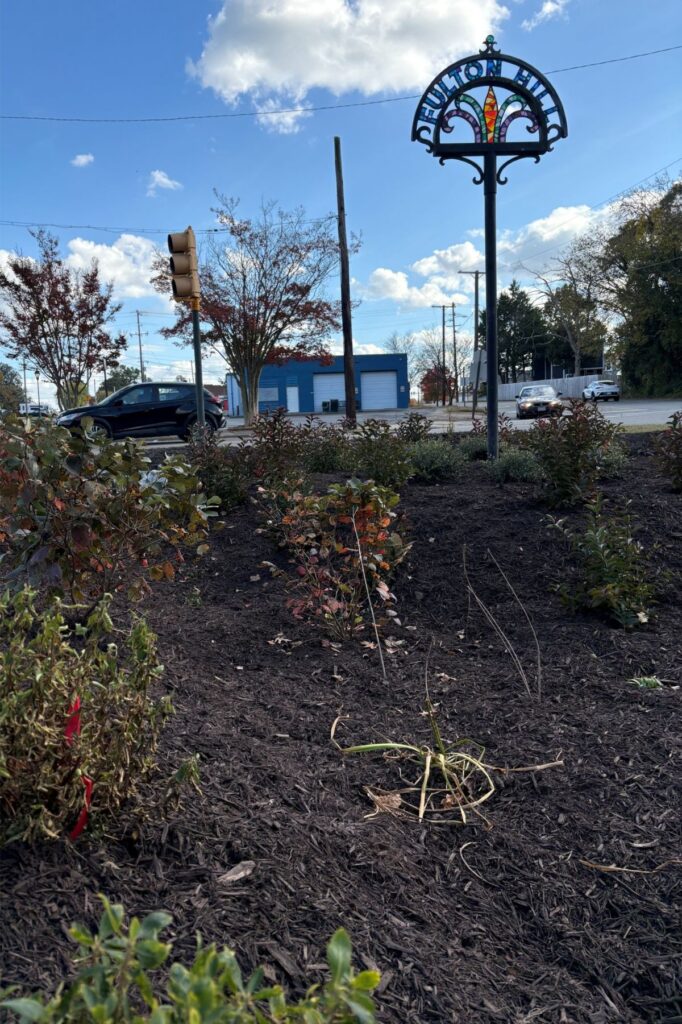
Interpretive elements extend throughout the site, from the entry sign depicting native plants (Figure 4) to multi-level spillways that add the intermittent sound of moving water — all reminders of the function of the park. The team provided space for other interpretive artwork, including a set of steps made to look like gears (Figure 5), which represent the “work” that natural systems do to clean stormwater. The steps create a trail from which visitors can observe various water levels while the system is actively working. By early 2025, two sculptures will be installed depicting the importance of trees in the water cycle and the role plants play in water quality improvement.
Figure 4. Andrew Papke-Larson of Barr Engineering designed the park entry sign, which welcomes visitors to Hasenbank Park and depicts a native plant whose roots clean stormwater.Figure 5. Gears by artist Christopher E. Harrison serves as a functional stairway.
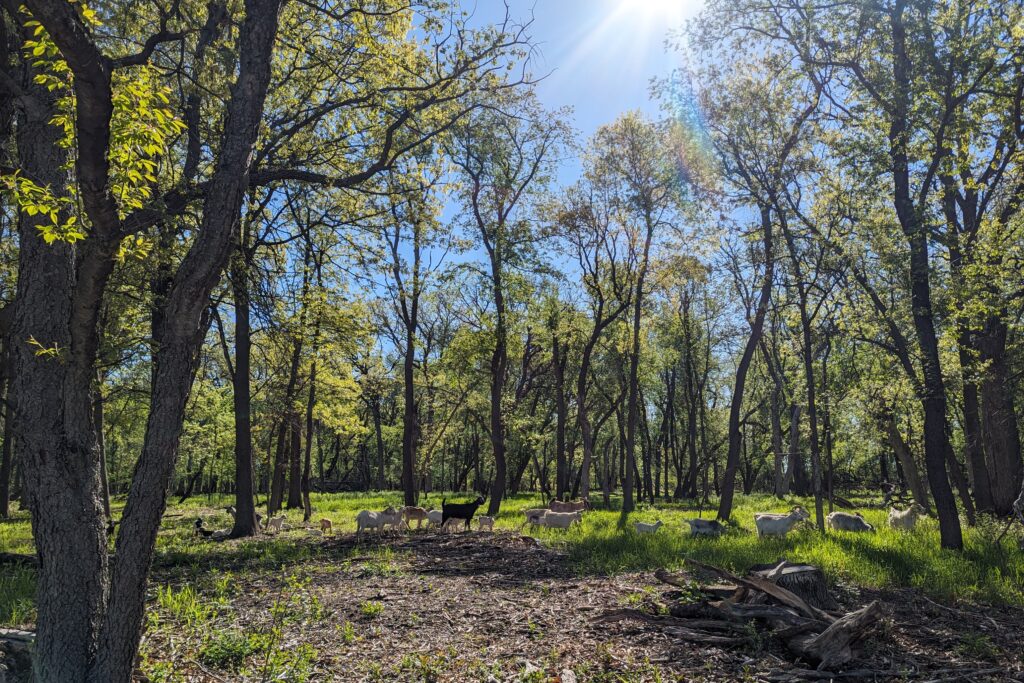
The park also incorporates adjacent Hasenbank Woods, which is owned by the city and protected by a conservation easement that prohibits development. Recently, the SWWD brought in teams of goats (Figure 6) to eat the buckthorn, a non-native, invasive species that was overrunning the woods. Once the ground was cleared, local volunteers helped seed native plants.
Design Challenges and Outcomes The Hasenbank Park design team had to address several challenges during the design process, as they worked to:
Create accurate simulation models to inform designs.
Design rain gardens that can accommodate water from Fish Lake while also providing a favorable growing environment for plants.
Optimize the amount of water entering the rain gardens from Fish Lake during storm events.
Select native plants that can tolerate both wet and dry conditions in the rain gardens.
Design a resilient system that can adapt to climate change.
Early in the design process, the team ran numerous model scenarios to create a flexible design that achieves the goal of infiltrating the water from Fish Lake without complete knowledge of the rate at which the soils are capable of infiltrating water over time. The team designed an overflow system for the rain gardens to route excess runoff into a nearby ditch if necessary. This increased flexibility gave the city and the watershed more confidence as construction began, because they knew that they could accommodate a range of different infiltration rates.
The system was also designed with a goal of future resilience. The pumps can be operated at varying rates and can be toggled on or off if more or less water is desired in the basins. This flexibility enables the SWWD to more easily adapt to future changes in the climate. The team approached plant selection for the site with similar care. Because the plants were key to controlling erosion, cleaning water, providing habitat and enhancing the aesthetics of the park, it was important to select plants that could tolerate both wet and dry conditions. Restoring Hasenbank Woods has resulted in an increase in biodiversity, and local wildlife have an additional 15 acres (16 ha) in which to live and find food.
The new park connects two heavily used walking trails, and the goal to foster curiosity from visitors is already being achieved. When team members come to check on the site wearing their safety vests, park users often stop them to ask questions.
The Future Hasenbank Park was designed with maintenance in mind. Early in the design process, the team discussed with city maintenance staff what it would take to easily maintain the finished product. For example, one of the few maintenance duties will be clearing the grate on the bypass pipe to prevent the pumps from clogging. The grate was designed to make this process easy. In addition, city employees will be able to check on the pumps from their computers. The team is creating an operations and maintenance manual to guide the city in maintaining this beautiful, functional park for years to come.
Figure 6. South Washington Watershed District regularly uses goats to clear Hasenbank Woods of buckthorn, an invasive, non-native species.
About the Experts
Marcy Bean, PLA, is Barr Engineering Co.’s project manager and landscape architect for Hasenbank Park. She has two decades of experience in innovative stormwater management in urban environments.
Heather Lau, PE, is a water resource engineer at Barr’s Minneapolis, Minnesota, USA office and was the project engineer for the Hasenbank Park project. She has 10 years of experience in stormwater modeling and water quality management.
John Loomis is the district administrator for the South Washington Watershed District in Woodbury, Minnesota, USA. He is an aquatic ecologist with over 20 years of experience.
Figure 1. The effect of fire intensity on above-ground vegetation and below-ground soil properties.
Wildfire is a natural phenomenon that can drastically alter watershed hydrologic conditions. Watersheds that experience wildfires can produce peak flows orders of magnitude greater than pre-fire conditions. This is due to several changes in the hydrology of burnt watersheds, especially in the first few years after the wildfire.
Reduced Infiltration Fires can create water-repellent layers in the soil that reduce the soil’s ability to absorb water. A water-repellent layer left after a fire is termed as hydrophobic, which means soil showing characteristics of water repellency. Hydrophobicity decreases rainfall infiltration and initial rainfall losses and increases direct runoff from a watershed. Through this process, water has a difficult time being absorbed into the soil (Figure 1).1
During the fire, convective heat and burning of the canopy produces organic litter on the forest floor. As the fire intensity increases, the conductive and radiant heat in the soil horizon goes deeper into the ground. This heats up the soil column and creates a water-repellent layer of ash and organic litter. The more intense a fire, the deeper it will burn into the soil column, and the deeper it burns into the soil column, the longer it takes for vegetation to reestablish itself on the canopy floor.
In poor or rocky volcanic soils, extremely hot fires can prevent reestablishment of vegetation for many years. As the erosion continues to wash away the topsoil, reestablishment of a suitable ground canopy becomes very difficult. Initially, ash can enhance infiltration by absorbing rainfall. However, as the ash is washed away, it can clog soil pores, leading to surface sealing and decreased infiltration rates. In particular, the clogging of soil pores, caused by small particles of ash and debris, reduces infiltration across the top layer of the soil, thus facilitating the development of increased surface runoff.2 Fires can also increase soil density and reduce porosity, permanently altering soil texture. This results in decreased water infiltration rates as well as decreased water storage capacity. Lastly, the types of plants and vegetation that grow after a fire may not be similar to the previous existing forest floor, as different plants compete for smaller resources of infiltrated water and stabilized top soil.
Post-wildfire debris flow from the “1,000-year rain event” in September near Jamestown, Colorado, November 2013. Photo credit: Jon White for the CGS.
Increased Runoff With the loss of vegetation, there is less interception (e.g., rainfall hitting and staying of tree leaves) of rainfall by plants. This results in more water reaching the ground. Fire-induced water repellency contributes to reduced soil infiltration rates, with stronger effects for higher fire severities. In particular, the clogging of soil pores, caused by small particles of ash, reduces infiltration across the top layer of the soil. With the absence of root structure to break up the top soil horizon and stabilize the slopes, the infiltration capacity continues to reduce.
Soil Erosion The removal of vegetation and the formation of water-repellent layers can lead to significant soil erosion. This can degrade water quality in streams and rivers by increasing sediment loads. This results in an increase in the soil erodibility factor, or K factor, used in the Revised Universal Soil Loss Equation that is often used to determine watershed annual sediment yield. Overall, there is more energy in the hydrologic system and the increased energy has more capability to transport soil particles necessary to reestablishment of vegetation.
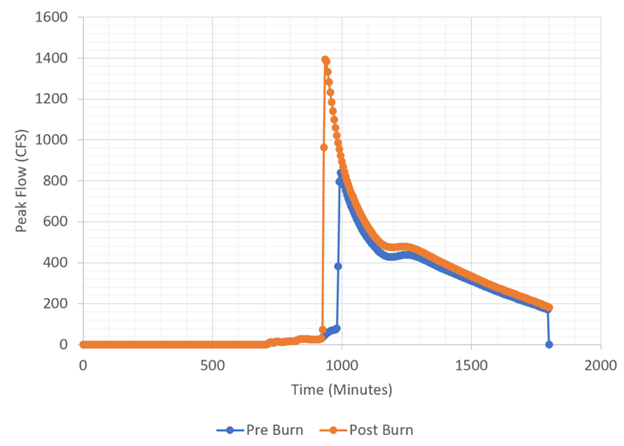
Streamflow Changes Fires can alter the timing and magnitude of streamflow. After a fire, there may be higher peak flows shortly after rainfall events due to increased runoff caused by decreased infiltration and lower base flows during dry periods because of reduced groundwater recharge. Such effects induce strong responses in watershed hydrology and flood hazards. In-situ measurements carried out in European and North American natural watersheds showed that the annual flood peak in post-fire conditions can increase between 1.2 and 10 times.2 Because there will be less interception from trees and vegetation, there will be less storage in the soil column. Both will cause the runoff to peak sooner than an unburned watershed. Additionally, the forest floor will have less roughness on the ground that increases overland flow wave velocities (Figure 2).3 The time of concentration and lag time decrease which creates a faster peaking flood wave — arriving downstream sooner (Figure 3).
Figure 3. Illustrative hydrographs for the pre- and post-fire 2-year storm.
Debris Flows The combination of increased runoff and soil erosion can lead to debris flows, which are fast-moving landslides that can carry large amounts of sediment, rocks and vegetation downstream. Additionally, the burned canopy and soil horizon increases the amount of sediment loss from a watershed since there are no longer roots and plants to hold the soil column during storm events. Entrainment of soil on hillslopes and in channels bulks up the sediment concentration of the rainfall runoff to generate debris flows capable of transporting boulders and large woody debris. Post-wildfire debris flows can be triggered by frequent and short duration rainfall conditions that would previously produce little runoff during unburned conditions.4
Bulking of Water Without trees and vegetation holding the soil column, there is an increased sediment loading that is detached first by rainfall impact, and then secondly from increased shear stress over the burned ground. Generally, there is more energy in the system and more sediment and debris available for transport, creating an increase in and “bulking” of flows.5 This means the peak discharge and total water-debris mixture must be increased by a factor determined from references.
Summary Hydrologic changes due to a watershed wildfire can lead to increased runoff, decreased time of arrival, erosion, bulking of sediment and water flow that impact water quality and watershed health. These results must be considered when designing erosion control measures while rehabilitating burned watershed. A critical consideration when reviewing post fire erosion and sedimentation studies is the Soil Burn Severity. It is also important to know if the study weighted the watershed area as partially being unburned, or if that study included entirely burned area. It is also important to know what methodology was assumed when erosion factors, Curve Numbers or statistical methods were used for post-fire parameter estimates. Results between studies based upon different methodologies can vary by an order of magnitude. In a technical note published by the Natural Resources Conservation Service, there is a notable difference between Appendix A and Appendix B in methodology and values between the High Park and Bitterroot Fires, in addition to Tables 3 through 8.6 This is in part due to the complicated nature of how a wildfire changes the watershed, the geographic location and the methodologies and assumptions for each study.
Folador L, Cislaghi A, Vacchiano G, Masseroni D. Integrating Remote and In-Situ Data to Assess the Hydrological Response of a Post-Fire Watershed. Hydrology 2021, 8, 169.
Elliot WJ, Elliot AV, Qiong W, Laflen JM. 1991. Validation of the WEPP model with rill erosion plot data, paper presented at the 1991 ASAE International Winter Meeting, Am. Soc. Of Agric. Eng., Chicago, IL, Dec. 1991.
David T. Williams, Ph.D., PE, PH, CFM, CPESC, BC.WRE, is president of David T. Williams and Associates, a water resources engineering firm located in the Denver, Colorado, USA area. During his 40 years as a member of IECA, he has served on the board of directors and was president twice.
Gerald Blackler, Ph.D., PE, BC.WRE, owns and operates Advanced Engineering and Academic Sciences, a Denver, Colorado, USA consulting firm. He is also an instructor at the University of Colorado – Denver College of Engineering, Design and Computing.
STEM education isometric background with stationery items calculator creative toys and little characters of children and teacher near blackboard vector illustration SSUCv3H4sIAAAAAAACA01RwWojMQz9FeHzsOmytxwXQqGwULa9lT1oZHXGxGMVWZ42hPn3lZOm9GbpPT09P53DiDVR2J9DyrlVU7QkJex/DoFjMtGEOezvtiFUQ2uVq3O9IjSeHL3UN5GXc++HfTjERlchn2ujd55oFslhG26U30jHSaWVWHfP/GFNXerG/gaG7d8QcOJCp77ZVytnxouRF4eO78a6fLpaU2S5PrHF1J9hFcLs+K/u2n8oS+9Oim9zIk0ra68jV9Lu8/nwB/hmH1KVhU0TwfhlCd6TzdDjcAbrCZLxUsG3UMvokQEpO7gymJwqoI/kZJYZaEZFcsMV5NWrlKNyuTCMkWZWKIwKY/Zto6BGWJm65Pfr/ICDnwZHFzw8Pl2m/3KJPpwKPDzew6vo4iEPwT561GH4zPyqVXckhfjNGuadMc1FskwnZ8nRD79t23/Wh/bXFgIAAA==
Erosion control and stormwater companies are often seen simply as environmental service providers. However, your businesses are deeply rooted in science, technology, engineering and math (STEM), making them crucial to sustainability and public safety. Recognizing and branding your company as a STEM-driven organization will grow your company and transform recruitment strategies.
At the heart of erosion control and stormwater management lies STEM. Science underpins the understanding of soil dynamics, water flow and ecosystems. Technology advances tools and materials, from geosynthetic fabrics to AI-driven systems for erosion prevention and water management. Engineering is essential in designing sustainable infrastructures like retention basins, green roofs and permeable pavements. Finally, math is crucial in calculating design elements like slope angles and water flow rates.
Embracing the STEM nature of your company is more than just a point of pride, it’s a competitive advantage. STEM companies are innovative, forward-thinking and impactful. Positioning yourself as a leader in environmental protection and technological advancement can attract high-caliber talent, which sets you apart from competitors.
Recruiting top talent is vital to grow. In a competitive job market where tech companies and startups vie for candidates, erosion control and stormwater management firms must stand out.
Reframing your company’s narrative is key. Branding as a STEM organization highlights the complexity and innovation behind your work. Candidates must see that you’re not just “moving dirt” or “installing drains.” They must see that you are solving real-world problems through science and technology.
Update your website, job descriptions and social media to emphasize the STEM aspects of your work. Share success stories and showcase your advanced technology, such as drone surveys, remote sensors and AI-driven models. This focus will attract A+ talent. Develop partnerships with universities, technical colleges and high schools with strong STEM programs. Offering internships, company tours or workshops helps build a talent pipeline that connects you with candidates who already understand the technical and environmental challenges you face. This connection gives you an edge in recruitment.
Offering ongoing training programs, certifications and workshops can help recruit and retain talent. Providing opportunities for employees to stay updated on the latest advancements in erosion control, environmental engineering and stormwater management adds value to their roles and boosts engagement.
Another way to strengthen skills and demonstrate your investment in professional growth is to collaborate with organizations like the International Erosion Control Association. These collaborations give your team access to thought leaders, conferences and certifications. STEM professionals excel in environments that foster collaboration and innovation. Success in our industry requires teamwork, with scientists, engineers, contractors and technicians collaborating to design effective solutions. This cross-functional teamwork fosters innovation and greater job satisfaction.
Building a formidable team is half the battle. Retaining team members is critical. High turnover disrupts projects and damages client relationships. Keep your talent engaged and loyal by offering clear career paths, leadership opportunities and promotions. Ensure your team knows that there’s room for them to grow up and that their efforts are recognized.
Erosion control often requires custom solutions. Allow your team the freedom to explore new ideas and experiment. Giving employees autonomy to innovate fosters a sense of ownership and pride in their work.
STEM professionals also value work-life balance. Offering flexible schedules, remote work options and paid time off improves employee well-being.
Erosion control and stormwater management are STEM industries at their core. By embracing this identity, you will elevate your brand, attract top talent and retain a skilled, motivated workforce. Prioritizing continuous learning, collaboration and innovation will ensure long-term success in this competitive, STEM-driven field.
About the Expert Judith M. Guido is the chairwoman and founder of Guido & Associates, a business management consulting firm in the erosion control and green industry. Guido can be reached at 818.800.0135 or judy@guidoassoc.com.


")
")