Home Blog Page 9

Designing To Achieve a Lower Salt Future

Figure 1. Deciduous trees provide summer shade but allow sun penetration in winter. The rear sidewalk has no winter shade but also no summer shade.

Chloride has promoted itself to a pollutant of top concern in many cold climates and highly populated regions of the world. In the United States, Minnesota annually spends more than $100 million importing road salt for temporary winter safety while accumulating a legacy of damages.1


The Real Cost of Salt
A big penalty is paid when using salt, as it harms infrastructure, soil, vegetation, wildlife and water. Even after salt is long gone from the winter months, chloride remains a permanent pollutant in the environment that affects:

  1. Soil and Vegetation
    Clay soil particles expand when they are exposed to sodium, making it difficult for water to infiltrate the soil and for plants to establish healthy root growth. Shallow root growth leaves plants susceptible to drought and leads to increased erosion. Invasive species that do well in compacted soils, like Canada thistle, crowd out more desirable species, further degrading biodiversity.

    Salt-tolerant species and hardscapes have been used to stabilize roadsides. However, these have resulted in a loss of habitat for species that rely on native plants for food, shelter and reproduction. Loss of habitat has pushed several species to become threatened with extinction.
  2. Aquatic Life
    As a permanent pollutant, chloride never degrades, it only accumulates. According to the United States Environmental Protection Agency (EPA), chloride is toxic to aquatic life at 230 mg/l. Canada has even stricter chloride standards of 120 mg/l. In cold climates with high expectations for winter safety and mobility, it is a struggle to protect the water.

Introducing Low Salt Design

Combating winter conditions by chemical melting is not sustainable, therefore new strategies are needed.

For decades, winter crews have been encouraged to dial down the salt. However, salt is an important tool against the poor winter performance of the built environment. Roadway safety often requires salt use. Low Salt Design aims to reduce these problem areas. Low Salt Design boosts winter performance of roads and sidewalks by using the sun, outsmarting the wind and considering meltwater drainage.

Connie Fortin, Low Salt Design strategist, has helped Bolton & Menk, Inc. develop the first of its kind in training and certification for Low Salt Design strategies, while making these trainings available to all of the firm’s civil engineers, landscape architects, planners and water resources staff. By listening to winter maintenance professionals and what was needed to improve snowplow conditions, Fortin was able to problem-solve their biggest concerns by integrating science into winter maintenance by considering 10 concepts that reduce the need for salt use. Three of the concepts are:

  1. Use the sun.
  2. Outsmart the wind.
  3. Plan for meltwater drainage.


Use the Sun
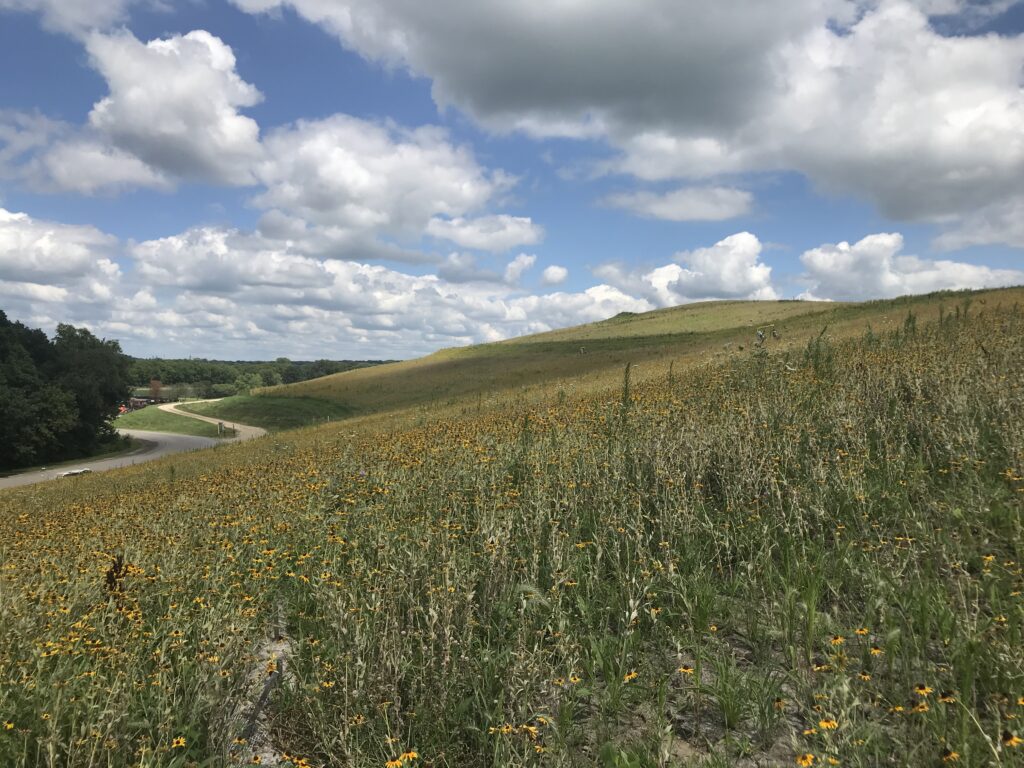
Anyone with a south-facing driveway understands the power of this strategy. No salt is needed if the sun shines on the pavement. If there is little winter sunlight to melt snow and ice, much more work and salt are needed to make those surfaces safe. It is a double salt penalty if the low spot of the road resides in the shade, such as under a bridge, or if critical braking, turning or high pedestrian uses are in the shade. Consider the placement and species of trees when using the sun: Conifers provide dense winter shade while deciduous trees provide less winter shade (Figure 1). Winter shade slows pavement recovery and increases the need for salt.


Outsmart the Wind
To outsmart the wind, designers should understand the angle of the winter wind, how many hours it can move snow sitting at rest and the distance the wind travels unimpeded to the site. If there is more than 1,000 feet (about 305 m) of uninterrupted winter wind to the pavement from the direction of the prevailing and frequent strong winter winds, take action. Design in a way to manage the wind and control the snow deposit. Unintentional snow fences break the energy of winter wind by depositing snow onto nearby pavements (Figure 2). These could be snowbanks, shrubs, tall grasses, cattails, fences or a variety of other natural barriers. It is best to control the wind and snow transport before it gets to the pavement, but if that opportunity is missed, it is better to let the wind carry the snow across the pavement than to drop the snow on the pavement.

Figure 2. Snow piles act as an unintentional snow fence, reducing wind energy and dropping the snow on the roadway.


Drainage
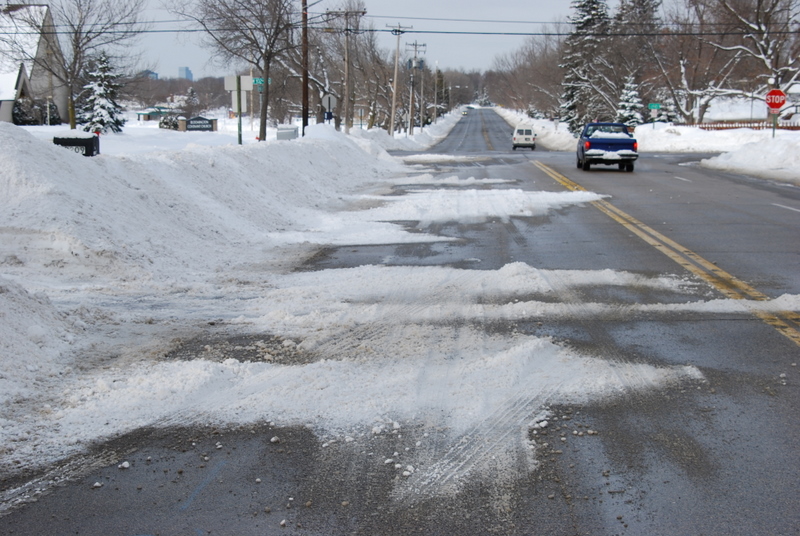
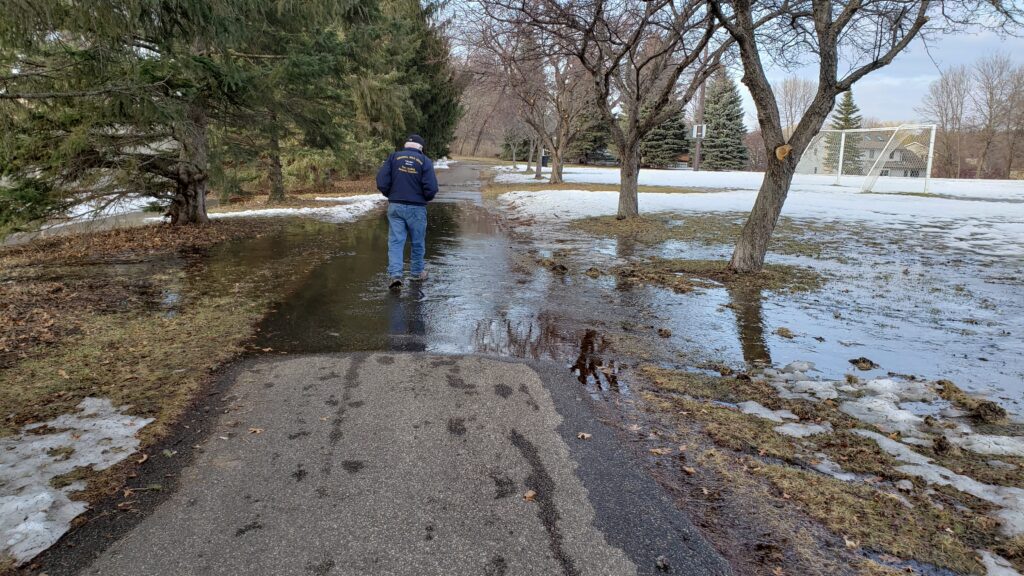
Have you considered the difference between stormwater and meltwater? It seems that designers are masters of stormwater management but novices at meltwater management. For winter maintenance crews, meltwater is a menace — most thaw/freeze cycles create problems for public works. When the snowmelt runs onto pavement it can freeze (Figure 3), and salt is used to treat the area. Controlling the meltwater footprint reduces this problem. Drainage design focuses on controlling the meltwater footprint. One way to disrupt the thaw/refreeze cycle is by placing snow storage on the downhill side of the pavement.

Figure 3. Meltwater sprawl from thaw/refreeze cycles that creates additional salting events.


Pay Attention to Critical Areas
Strategies to navigate lower salt use are incredibly useful, but their ultimate value depends on which strategy is used and where it is applied. When examining salt use, it becomes apparent that higher amounts of salt are found in critical areas, such as high-speed roads and superelevated surfaces like highway ramps, bridges and building entries. Critical areas are where traction is important and where maintenance crews do not stop until they reach bare pavement.


In critical areas, we see soil sterilization, difficulty establishing plants, high erosion potential and endless attempts at sediment control. Designing for lower salt is the most cost-effective solution and offers hope of improved soil stability and reduced soil erosion and sediment movement. Improved soil health will advance opportunities to use native plantings that support local biodiversity to reestablish a healthier ecosystem.


Reducing compacted soils and improving soil structure will increase the soil’s ability to infiltrate stormwater and meltwater runoff from impervious surfaces. Healthy root systems will improve the drought tolerance of roadside plants and help anchor soil particles in place, increasing the longevity and effectiveness of plantings. Enhanced plant health further improves the ability of soil to absorb runoff and reduce downstream erosion and flooding.


Low Salt Design should be a standard practice in cold climates. By using Low Salt Design strategies in critical safety areas, communities and winter maintenance professionals get the best return on their investment.


References:

  1. State Winter Maintenance Data and Statistics. Clear Roads Winter Maintenance Spreadsheet, p. 1–7.

Resources
To learn more about Low Salt Design visit:

Enhance Sediment Capture with Polymers in Lined Ditches and Channels

Figure 1. The blocks provide a polymer that results in the sediment trapped by jute netting laid over a plastic liner. Note the clear water at the lower part of the lined channel.

Contractors often use open ditches to convey water from one location to another on construction sites. An inherent problem with this practice is that the flow scours the soil along the path and adds more sediment into the flow. The solution to this scouring problem is to line the ditch or channel with a protective layer such as jute, vegetation or other erosion control matting. It is even more effective when polymers are used to capture and retain sediment on the liner before the flow reaches its terminal point.
Polymers are long-chain chemical compounds that attract and bind multiple soil particles into a single unit, large enough to drop out of the flow as sediment. Polymers are available in granular, logs and liquid forms. Polymers may also be positive, negative or neutrally charged. Anionic polymers such as anionic polyacrylamide have a low toxicity to aquatic organisms and cationic polymers like cationic polyacrylamide and chitosan have a high toxicity. Therefore, anionic polymers are most often used and allowed for environmental and stormwater applications.


Anionic polymer logs treat water passively, they are not toxic to people or the environment, and they can be used in a wide range of pH and temperatures. If polymer is still present at project completion, polyacrylamide logs and products are non-hazardous and do not require any special disposal considerations. All polymer treatments for erosion, sediment and water should be done in accordance with local, state and federal requirements.


Polymer Benefits in Lined Ditches
Used in conjunction with channel liners, polymers can treat a large volume of sediment-laden water. Installing polymer logs at the origin of flow is the key to success. Water flows over the log and the logs slowly dissolve. Soil particles adhere to the dissolved polymer and as water continues to flow a snowball effect occurs creating flocs to form larger masses that settle in quiescent areas on the liner. Enhanced sediment trapping on the liner can be achieved if jute netting is installed on the plastic liner (Figure 1). The polymer-sediment mass readily attaches itself to natural fibers such as jute, hemp and coir.


When used correctly and matched to a site’s specific soil and water chemistry, flocculants such as those provided by polymer logs can remove a significant amount of suspended sediment without substantial added costs or changes to existing infrastructure and BMPs.
Polymer logs can last a long time depending on site conditions such as flow rate, velocity and temperature. Contractors on low-flow and shorter duration projects can save money by purchasing smaller sizes or by cutting up a larger log into smaller units for use in other locations. Multiple small units placed in mesh baskets also provide more surface area than will one large unit.


Challenges in Lined Ditches
The desired effect of washing polymer from the block is reduced when it is exposed to air. The surface hardens which makes the block less soluble. Sediment can also cover the surface of the polymer log, creating a “skin.” If the logs become coated with sediment, they need to be brushed or washed off to continue working properly.


Conclusions
Polymer logs can work to significantly remove suspended clays and other sediment in water from construction activities. To ensure effective results, it is important to use the flocculants correctly and understand what polymer forms are best suited to each application. 


[Editor’s Note: This is the second article in a series of three that address the use of polymers for erosion control on jobsites. The first article addressed the use of polymers on soil and the next article will discuss polymer applications for quiescent ponds.]


About the Experts
James W. Spotts, M.S., Ph.D., CPSS, CPESC, represents Southeast Environmental Consultants LLC. His company assists contractors having environmental problems during construction. Known as “Dr. Dirt,” Spotts is a long-time member of IECA.

Constructed Floating Wetlands to Reduce GHG Emissions and Remove Contaminants

Figure 1. Floating wetland system installed at Cowes Wastewater Treatment Lagoon. Photo credit: Westernport Water.

Westernport Water, a wastewater utility in Phillip Island, Victoria, is transforming a wastewater lagoon into a plant-filled wetland to explore how Australian native wetland plant species can improve water quality, reduce greenhouse gas emissions and manage emerging contaminants such as per-and polyfluoroalkyl substances (PFAS). This two-year research project commenced in 2023 and involves the installation of a constructed floating wetland (CFW) system on a wastewater lagoon at the Cowes Wastewater Treatment Plant. It is anticipated that early results will be available in 2024. The project is the first field-scale study looking at how nature-based solutions can be used to reduce greenhouse gas emissions from wastewater treatment plants while simultaneously acting to remove contaminants and improve water quality. While this study is focused on wastewater, the outcomes will inform and benefit similar projects in a broad range of sectors including stormwater management as emerging contaminants and excessive nutrient loading are not issues exclusive to wastewater.

Constructed floating wetlands, which are also called floating treatment wetlands, free-floating wetlands or artificial floating islands, are a relatively novel nature-based water treatment technology that has seen a sharp increase in adoption during the last 20 years.1 CFWs have been used for both stormwater and wastewater treatment, as well as for provision of habitat and for aesthetic enhancement.2
Constructed floating wetlands are designed to mimic the functions and appearance of natural floating islands but are designed to provide enhanced treatment functions. These functions are similar to traditional constructed wetland systems, but also have the treatment attributes typically associated with a pond/lagoon system. A buoyant structure supports the growth of plants on the structure’s surface, with the root mass growing directly into the water column, similar to a hydroponic system. The plant roots utilise nutrients within the water column to increase biomass. The root mass also provides a significant surface area that is colonised by microbial biofilm. These biofilms are microorganisms that sequester and remove nutrients through adsorption, absorption and phytodepuration. A significant benefit of CFWs is that they can be retrofitted into existing waterbodies, require no additional land area and do not take up any flood storage volume because they float on the water surface.

A 330-m(3,552-foot) CFW system was installed at the Cowes Wastewater Treatment Lagoon2 in April 2023, following background monitoring of the system to determine baseline values regarding emissions and nutrient concentrations (Figure 1).
A detailed record of water quality data was provided by Westernport Water to better characterize the typical water quality attributes of this system. Following the installation, monitoring of nutrients, emerging contaminants and greenhouse gas emissions commenced. The system is monitored at the start and end of the CFW system, with a paired control established adjacent to the system so the performance can be characterized (Figure 2). Presently, the constructed floating wetland is in the plant establishment phase, with 900 individual plants of Phragmites australis (common reed) and 900 plants of Baumea articulata (jointed rush) being monitored for shoot and root development monthly.

Figure 2. Experimental design, with floating wetland system and control channel, separated by baffle curtain. Photo credit: Blue Carbon Lab, Deakin University.

Research by Deakin University’s Blue Carbon Lab documented that a direct link exists between dissolved nutrient concentrations and greenhouse gas emissions, specifically methane. Based on data from smaller systems, reducing total nitrogen and phosphorus leads to a disproportionately higher reduction in average methane emissions.3,4 As the plants utilise nitrate to grow, we hypothesise that lower nutrient concentrations will reduce methane emissions from the wastewater lagoon. Further, the plant species utilised in this study can be harvested.

A similar study5 in Queensland, Australia, showed that harvesting Baumea articulata shoots can remove approximately 104 and 13 g/m of nitrogen and phosphorus, respectively (0.02 and 0.003 pound/foot).2
In relation to emerging contaminants, recent research by the Commonwealth Scientific and Industrial Research Organisation (CSIRO) has demonstrated that both Phragmites australis and Baumea articulata uptake and sequester two PFAS, namely perfluorooctanoic acid and perfluorooctane sulfonic acid.6 Though these substances are commonly found in wastewater and stormwater at very low concentrations (ng/L levels), PFAS present an emerging problem for wastewater utilities because wastewater treatment plants have difficulty removing these contaminants. Constructed floating wetlands have the potential to offer a low-cost, simple method to remove such pollutants via plant uptake and harvesting. The harvested material can then potentially be converted into biochar/activated carbon via pyrolysis, which destroys the PFAS.

This project is a collaborative partnership between Westernport Water, Deakin University (Blue Carbon Lab), Covey Associates Pty Ltd, Clarity Aquatic and the CSIRO. Westernport Water staff is supporting scientists from Deakin University and CSIRO to assess the effectiveness of the floating wetland plants in removing dissolved nutrients and emerging contaminants from treated wastewater. Assessments also evaluate how well the system functions at both improving water quality and reducing greenhouse gas emissions.
This technology does help organizations achieve sustainability goals in several ways. Greenhouse gas emissions are reduced through nature-based solutions on existing infrastructure. By expanding the capacity or extending the length of time before expansion is needed, floating wetland systems can eliminate or defer the need to build new infrastructure. Further, the floating wetland system utilised in this project is 100% recyclable and the plant material will be harvested and composted for the purpose of land management projects where possible, or potentially converted into materials such as biochar which will have a further potential use for water quality improvement. 

References:

  1. J. Ayres, J. Awad, C. Walker, D. Page, J. van Leeuwen, S. Beecham, Constructed Floating Wetlands for the Treatment of Surface Waters and Industrial Wastewaters, in: N. Pachova, P. Velasco, A. Torrens, V. Jegatheesan (Eds.), Regional Perspectives of Nature-based Solutions for Water: Benefits and Challenges, Springer International Publishing, Cham, 2022, pp. 35-66. https://doi.org/10.1007/978-3-031-18412-3_3.
  2. Lucke, T., Walker, C., Beecham, S., Experimental designs of field-based constructed floating wetland studies: A review. Sci. Total Environ., 2019 660, 199–208.
  3. Malerba, M.E., Lindenmayer, D.B., Scheele, B.C0, Waryszak, P., Yilmaz, I.N., Schuster, L., Macreadie, P,I. Fencing farm dams to exclude livestock halves methane emissions and improves water quality. Glob. Chang. Biol. 2022; 28: 4701-4712.
  4. Ollivier QR, Maher DT, Pitfield C, Macreadie PI. Punching above their weight: Large release of greenhouse gases from small agricultural dams. Glob. Chang. Biol. 2019; 25: 721-732.
  5. Huth, I. Walker, C. Kulkarni, R. and Lucke, T. Using Constructed Floating Wetlands to Remove Nutrients from a Waste Stabilization Pond. Water, 2021, 13, 1746. https://doi.org/10.3390/w13131746.
  6. J. Awad, G. Hewa, B.R. Myers, C. Walker, T. Lucke, B. Akyol, X. Duan, Investigation of the potential of native wetland plants for removal of nutrients from synthetic stormwater and domestic wastewater, Ecological Engineering 179 (2022) 106642. https://doi.org/10.1016/j.ecoleng.2022.106642.

About the Experts
Christopher Walker, BEnvSc., BSc (Hons), Ph.D., CPESC, is an associate and manager of the Water, Environment & Bushfire divisions at Covey Associates Pty Ltd., Maroochydore, Queensland, Australia.
John Awad, BSCE (Hons), MSCE, Ph.D., is a research engineer at the Commonwealth Scientific and Industrial Research Organisation (CSIRO) in South Australia, Australia.
Martino Malerba, BSc, BSc (Hons), Ph.D., is an Australian Research Council Discovery Early Career Research Award Fellow at the Blue Carbon Lab, Deakin University, Melbourne, Victoria, Australia.
Lukas Schuster, BSc, MSc, Ph.D., is a postdoctoral research fellow at the Blue Carbon Lab.
Terry Lucke, Ph.D., FIEAust, CPEng, RPEQ, EngExec, NER, is a senior civil and environmental engineer at Covey Associates Pty Ltd.
Divina Navarro, Ph.D., is a research scientist at CSIRO.
Ilse Hall, BSoc.Sc, DipPM, is a project officer at Westernport Water, Newhaven, Victoria, Australia.
Melinda Glew, BSc, is a climate change and environment advisor at Westernport Water.
Meg Humphrys, BSc (Hons), is a liveability communities advisor, Water Services Association Australia.

Doubling Down: A Risky Approach When Hydroseeding with Native Seed

Figure 1: Biotic soil technologies were applied with native seed blend at typical rates on the Dane County Landfill.

The importance of specifying and implementing erosion control and custom seed mixes for permanent stabilization on construction sites is frequently overlooked. Often, erosion control and revegetation sections in project specifications are simply copied and pasted from previous projects or are boiler-plated from state or federal agency standards. While the erosion and sediment control industry may place a strong emphasis on these aspects of design documents, the successful establishment of vegetation is often not the primary goal, resulting in limited attention.


As the focus on post-construction land use gains prominence, the incorporation of resilient, low-maintenance and ecologically-beneficial native seed mixes has become more common. Unfortunately, native seeding comes with decades of unverified requirements regarding seeding rates and application methods. One such requirement is the insistence on doubling seeding rates when hydroseeding native seed blends. While this may be a useful practice in some instances, the widespread adoption of this method can result in poor revegetation efforts, also driving up costs. It is believed that this argument to increase seeding rate is largely based on the fact that seed to soil contact is critical.


However, there have been numerous successful native seeding projects hydroseeding with biotic soil technologies and fiber reinforced matrix that rarely result in traditional seed to soil contact (Figure 1). Rather, the seed remains in suspension within the matrix of the biotic soil product. Biotic soil provides a cocoon of ideal temperature and moisture to maximize seed germination rates, which is important for native seeds. The erosion control component (Figure 2) ensures the seed and soil remain intact and on target until root development into the soil occurs.

Figure 2: Flexible growth medium applied over the biotic soil technology and seed layer to provide erosion protection.


Due to these misconceptions, planners or project managers can engage professional restoration ecologists when designing custom native seed blends. Restoration ecologists will take numerous site attributes into consideration when designing seed mixes including soil structure/type, soil hydrology, slope gradient, exposure angles, budgetary constraints and overall project objectives.
Professional restoration ecologists can also provide insight into metrics like the coefficient of conservatism, which is an indicator of how difficult the species is to establish and its longevity. Another metric is intra-species interactions within a mix, which is a measure of how individual species will interplay and relate to one another and is based on monitoring data and previous observations. Additional considerations should include morphological variation (height, stature, dominance), phenological bloom periods and overall ecological impact (pollinator support and biodiversity lift).


Unfortunately, most state and federal agency specifications for native seed mixes, which are often expensive, are highly driven by available funding. For instance, most United States Department of Agriculture Farm Bill program native seed mixes are installed at a rate of roughly 5.6 Pure Live Seed (PLS) kg/ha (5 PLS lb/acre), which is a fundamentally low rate. Native grass seed is far less expensive as compared to native wildflower (forb) or native legume seed, so most agency-specified seed mixes are 80% to 90% grass by volume, which leads to reduced ecological and sustainability value and increases maintenance.


Other critical factors when selecting a native seed blend and application rates in the field include:

  • Use of Pure Live Seed

Native seed mixes should always be designed and purchased with Pure Live Seed in mind. It is a function of seed viability or how much of the given seed lot is actually viable seed and seed purity or how much weight by total volume of the seed lot is inert material such as stem, chaff, beard, appendage or debris.

  • Timing of Establishment and Nurse Crops

Spring native hydroseeding in the upper Midwest will have the highest success. The primary nurse crop in this particular region is annual Esker oats, which does not release allelopathic compounds like Annual Ryegrass, and should be tank-mixed and applied with the native seed.

  • Expectations
    The phrase regarding native vegetation establishment is as follows: Year one it sleeps, year two it creeps, year three it leaps. While some natives may germinate early, it often takes years to establish (Figure 3).
  • Species-specific Requirements
    Some native wildflower species require cold-moist stratification to germinate while many native legumes require bacterium inoculant to germinate.
  • Size of Seeds
    Native seed mixes should be designed to consider seeds per square foot rather than just Pure Live Seed mass per area. Seeds per square meter or seeds per square foot, takes into account the size of the individual species’ seed and the proposed application rate. Native wildflower seed can range from 11,000 to 1,100,000 seeds per kg (5,000 to 500,000 seeds per pound). Incorporating seed mixes and application rates that account for these considerations will allow vegetation to establish in an ideal environment that minimizes overcrowding.


Dane County Case Study
Poor soil installed on 3H:1V slopes at the Dane County Landfill project near Madison, Wisconsin yielded mixed vegetative results, to the point that the county wanted to reevaluate the soil conditions, vegetation and installed erosion control. Soil conditions included nutrient-depleted and microbially/biologically marginalized and stockpiled soil. The vegetation goal on the site was to establish a pollinator-friendly native seed blend that would reduce long-term maintenance costs, improve the resiliency and aesthetics, and provide ecological benefits. The material selected by a restoration ecologist to improve soil health was biotic soil with a flexible growth medium was applied over it to protect the seed and soil until vegetation was permanently established. The designed and installed native seed mix was specified at rates comparable to conventionally broadcasted or drilled seed (approximately 10 PLS pounds per acre). The vegetation performance standards for the site were attained on time and on budget (Figure 4).


Ongoing Study
While there are countless examples of successful native hydroseeding applications using drill seeding rates, a three-year study is currently underway at Stantec Native Plant Nursery in Walkerton, Indiana, to study this more closely. Early results show that establishment has been improved when applying native seed blends at drill seeding rates when compared to doubled seeding rates. Once this study has concluded, a white paper, presentation and any conclusions will be made available.


As the construction industry has seen a growing emphasis on post-construction land use, the countless benefits of native vegetation are being considered more and more. While this land use, when successfully implemented, is undoubtedly beneficial, the many intricacies surrounding native prairie establishment must be reviewed. Incorporating outdated assumptions like “double seed rate when hydroseeding native seed blends,” can result in damaging consequences that add cost, require more resources and produce disappointing results.


More Information
Learn more about the Dane County Landfill project in this video recap: https://www.youtube.com/watch?v=uO8vvdjGMc8&t=66s.

About the Experts

  • Matthew M. Welch, CPESC, CESSWI, is director of technical development at Profile Products LLC.
  • Clayton Frazer, principal ecologist and co-founder, Native Range Ecological. Frazer, previously with Eco-Resource Consulting, specializes in vegetating challenging site conditions with native vegetation.

Sediment Basin Water Quality on a Large Highway Construction Project

Table 1. Sediment basin water quality. Basin 1 consistently received PAM application.

The process of clearing and grading land for construction projects usually results in highly turbid runoff while construction is underway. Construction projects are required to have an erosion and sediment control plan that uses the best management practices (BMPs) such as sediment basins, check dams, inlet protection and silt fences. These practices have been improved and refined to retain most of the larger particles generated on site. However, the smaller particles still will create high turbidity for construction stormwater. Polyacrylamide (PAM) can reduce the turbidity of the construction stormwater if properly placed in ditches and pipes leading to sediment basins. Discharging cleaner water from construction sites is particularly important in areas draining to sensitive waters, such as the Swift Creek watershed in Raleigh, North Carolina, which is home to an endangered freshwater mussel.


Research Objectives
The objective of this project was to monitor sediment basin water quality — turbidity and total suspended solids (TSS) — with various levels of BMP management and PAM application on an active construction site.

Figure 1. Sediment basin sampler setup. Samples were taken from the first baffle and the skimmer outlet by automatic samplers triggered by increased water level.


Methodology
Monitoring was conducted between March 2020 and December 2022 during the construction of I-540 in Raleigh. Sediment basins were designed, constructed and maintained by contractors according to North Carolina Department of Transportation specifications. The size of the basins varied depending on the watershed design and potential runoff. Seven sediment basins were monitored during this sampling campaign, where two to three basins were monitored at a time. Basins were monitored for six to 12 months depending on surrounding grading activities.


Automatic samplers were installed at each basin to take samples at the first baffle and the skimmer (Figure 1). While sampling at the inlet of the basin would have been preferred, the location was avoided due to previous experience with sampler clogging due to high sediment loads. A sensor connected to a remote monitoring station was placed on the first baffle to monitor water level change in the basin. Samples were taken by the automatic sampler when there was a 0.5 foot increase in the basin water level and every hour after the initial sample as long as the water level was above the 0.5 foot increase. Rainfall data was collected from a tipping bucket rain gauge by the basin. The flocculating agent chosen was PAM 705 (Applied Polymer Systems, Woodstock, GA). A granular form of PAM was applied in 4 oz. increments to each wattle in the ditch leading to the basin. Collected samples were analyzed for turbidity1 and TSS.2 Averages, minimums and maximums for turbidity and TSS were calculated for each rainfall event for each basin and overall, for each basin when the monitoring concluded. Basin 1 represented the “best case scenario” for watershed and BMP management and PAM application on wattles in the ditch leading to the basin, with the remaining having lesser degrees of management.


Findings
Basin 1 had the lowest average turbidity (56 NTU) and TSS (58 mg/L), while Basin 7 had the highest average turbidity (1,822 NTU) and Basin 5 had the highest average TSS (1,550 mg/L) (Table 1). The North Carolina Department of Environmental Quality has set turbidity standards for freshwater streams at 50 NTU and trout streams at 10 NTU.3 The turbidity of Basin 1 averaged just above the limit for freshwater streams. All other basins are well above the 50 NTU recommendation, even for the minimum values, but had discharge turbidities similar to basins in other studies.4 Basins 1, 3 and 7 are detailed below and represent the range of discharge water qualities in the study — the good, the bad and the ugly.

Figure 2. Sediment basins at the start and end of monitoring.


Basin 1 (the good) was the first basin monitored. Much of the area around the basin was covered with grass or erosion control fabric during the monitoring period (Figure 2) and had lower levels of watershed disturbance. Very little earthwork or tree removal was occurring in the basin watershed. The minimal earthwork, good ground cover and consistent PAM application probably led to Basin 1 having the lowest average turbidity and TSS. Basin 2 was concurrently monitored with Basin 1 but did not receive PAM application. Basin 2 was in the adjacent watershed also with good ground cover and little earthwork. PAM application in Basin 1 led to a four times reduction in turbidity and a 2.5 times reduction in TSS compared to Basin 2. However, basin and watershed size were different, so it is hard to directly compare these results.


Basin 3 (the bad) represents the average sediment basin monitored for this project. There was more groundcover at the start of the monitoring compared to the end (Figure 2). Ditches were well maintained in the beginning, but their conditions deteriorated as less emphasis was placed on erosion control practices during the progression of construction and increased amount of earthwork happening in the basin watershed. The increased earthwork in the basin watershed and the increased number of rainfall events could have caused Basin 3 to have higher turbidity and TSS compared to Basin 1 — more earthwork, more rainfall, more erosion potential. As grading activities progressed, more runoff entered the basins without passing through the ditches where PAM treatment could occur. High sediment loads can also overwhelm the PAM treatments.


Substantial earthwork was happening during the monitoring of Basin 7 (the ugly). The area in front of the basin was cleared shortly after monitoring began, and few erosion control practices were implemented (Figure 2). A soil stockpile started to be stored next to the entrance of basin and continued to grow over time with no cover, which lead to extremely high sediment loads entering Basin 7. As mentioned previously, it had the highest average turbidity and second highest average TSS (Table 1). Even though the basin may have been sized correctly for the drainage area, the soil stockpile next to the inlet of Basin 7 clearly overloaded the basin with sediment. The soil stockpile could have been covered periodically to reduce raindrop detachment, or the basin should have been resized to accommodate the higher sediment loads.


There was a trend of turbidity and TSS reduction as the water moved from the first baffle to the skimmer for all basins monitored. Sediment basins reduced the sediment loads in the stormwater within the basin, but not as much as needed in a sensitive waterbody. Because the inflow sample was located at the first baffle to avoid clogged sampling tubing, the reduction in turbidity and TSS is likely underestimated. Previous studies have indicated these basins will capture greater than 90% of the sediment coming into them.


Conclusions
Consistent ground covers and BMP maintenance along with PAM application was found to reduce turbidity and TSS discharged from the sediment basins. There was a clear connection between the amount and type of grading activities and the ability of PAM treatments to be effective. Often the large amount of sediment passing through diversion ditches where there were high disturbance levels and little or no
ground cover overwhelmed the practices. Poor site management has the potential to overwhelm well-designed erosion and sediment control practices. A well-managed site with distributed PAM dosing (as in the case of Basin 1) can produce much better discharge water quality. 


Acknowledgements
This research was supported by Adam Howard, Jamie Luther and Christopher Niewoehner. The North Carolina Department of Transportation sponsored the research presented in this article. The findings expressed in this article are those of the authors and do not necessarily reflect the view of the sponsors.


References

  1. O’Dell, J.W., 1993. Method 180.1: Determination of turbidity by nephelometry. United Stated Environmental Protection Agency, Washington DC. Available at: https://www.epa.gov/sites/production/files/2015-08/documents/method_180-1_1993.pdf.
  2. U.S. EPA, 2003. Protection water quality from urban runoff. U.S. Environmental Protection Agency. Available from: https://www3.epa.gov/npdes/pubs/nps_urban-facts_final.pdf (retrieved 09 March 2023).
  3. North Carolina Department of Environmental Quality. Fresh surface water quality standards for class C waters. Available from: http://reports.oah.state.nc.us/ncac/title%2015a%20-%20environmental%20quality/chapter%2002%20-%20environmental%20management/subchapter%20b/15a%20ncac%2002b%20.0211.pdf (retrieved 07 August 2023).
  4. McLaughlin, R.A. & Jennings, G., 2005. Minimizing water quality impacts of roadway construction. NCDOT Research Project Number 2003-04. North Carolina Department of Transportation.


About the Experts

  • Christina Kranz, Ph.D., is a lecturer at North Carolina State University (NCSU). She teaches introductory soil science and facilitates workshops at the Sediment and Erosion Control Research and Education Facility.
  • Joshua Heitman, Ph.D., is a professor of soil physics at NCSU. His research focuses on developing techniques to quantify soil physical processes and improve services of soil systems.
  • Rich McLaughlin, Ph.D., is emeritus professor at NCSU. He retired after 30 years of education and research to improve water quality, focusing on the impacts of runoff on surface waters.

Grass Seed Capital of the World

Figure 1. A perennial ryegrass production field in the Willamette Valley in Oregon is cut, windrowed and left to field-dry. Photo credit: Oregon Grass Seed Commission.

Vegetation establishment is recognized as the most effective Best Management Practice for stabilizing disturbed ground to prevent erosion and is often a prerequisite for receiving a Notice of Termination for a permitted construction project. Many projects have specific requirements for the type of vegetation that must be replanted and most have a threshold for percent establishment, typically 70% of the pre-disturbance stand. Not all revegetation species are grasses, some are legumes and forbs. Sometimes the seeds specified for revegetation are native ecotypes and other times they are turf and/or forage species. Have you ever wondered where the seed comes from?
The Pacific Northwest of the United States has long been a place of myth, legend and lore; from the indigenous people who lived in the region for millennia prior to the arrival of European settlers, to the exploits of Louis and Clark in their quest for manifest destiny, to the elusive Sasquatch or Bigfoot. But did you know that a majority of the world’s seed production of cool season turfgrass and forage species comes from this region as well?


In 2017, Oregon recorded 400,000 acres (162,000 ha) of grass seed production grown on approximately 1,500 farms with most of that acreage located in the Willamette Valley of Oregon. The Willamette Valley alone accounts for two-thirds of the United States’ cool-season grass seed production earning it the title, “Grass Seed Capital of the World.”
Why Willamette Valley?


The Willamette Valley is 150 miles (240 km) long and surrounded by mountains on three sides: the Oregon Coast Range to the west, the Cascade Range to the East and the Calapooya Mountains to the south. The Willamette River flows the entire length of the valley from its headwaters in the mountains just south of Eugene, Oregon to its confluence with the Columbia River in Portland, Oregon. There are three main reasons the valley leads the nation in grass seed production: climate, soils and agricultural history.

Figure 2. Ryegrass seed and hops were two of the many crops in the mid-19th century that formed the foundation of the Williamette Valley’s agricultural success. Photo credit: Oregon Historical Society. Research Library, neg. no. 18981.
  1. Climate
    The Willamette Valley is located halfway between the North Pole and the equator with four distinct seasons. The temperate climate and wet winters provide a long growing season for the plants to develop while the arid summers support pollination, seed head development and harvest. This makes the Willamette Valley an ideal place to produce high quality seed. While it is not uncommon to experience precipitation from October through June, the region can usually count on 90 to 100 days without precipitation during the summer months. That allows grasses and legumes like clovers and alfalfa grown in Oregon to be cut, windrowed and allowed to dry in the field prior to harvesting with a combine harvester (Figure 1). Other seed producing regions of the world have to put the seed through a commercial process that heats the seed to dry it out. This process has the potential to damage the seed and subsequently affect germination rates. The heating process is also considerably more labor and resource intensive than allowing seed to dry in the field.
  2. Soils
    The Willamette Valley has an extraordinary variety of soil types with over 2,000 distinct soil classifications. This abundant diversity is owed to one specific force of nature: erosion. The Missoula Floods inundated the valley multiple times between 13,000 to 15,000 years ago at the end of the last ice age. Periodic rupturing of Glacial Lake Missoula’s ice dams caused flood waters to sweep down the Columbia River stripping rich glacial and volcanic soil from eastern Washington. The water from these floods filled the entire Willamette Valley to a depth of 300 to 400 feet (91 to 122 m) above current sea level and deposited soil one-half mile (1 km) deep in some areas as the waters subsided.1,2
  3. Agricultural History
    In the 1820s the Willamette Valley was widely promoted as a “promised land of flowing milk and honey” due to its numerous waterways, highly fertile soils and broad, flat plains. It was the destination of choice for many immigrants who undertook the perilous journey along the Oregon Trail by oxen-drawn wagon trains. The Willamette Valley was home to a variety of native grasses prior to white settlement. Non-native grasses had replaced many wild grasses by the late 1800s due to the introduction of livestock and overgrazing (Figure 2).

    In 1921, Forest Jenks of Linn County planted the first commercial ryegrass in the valley. The ryegrass was especially well adapted to the wet soils and soon became an important crop. Grass seed quickly became an excellent alternative crop for the highly erodible soils found in the valley’s foothills, and by the 1940s seed production rapidly increased due to agricultural mechanization and the introduction of new grass varieties. Oregon growers today produce essentially all of the United States’ commercial production of annual ryegrass (Lolium multiflorum), perennial ryegrass (Lolium perenne), bentgrass (Agrostis spp.) and fine fescues (Festuca spp). They also produce significant amounts of Kentucky bluegrass (Poa pretensis), orchardgrass (Dactylis glomerata), and tall fescue (Festuca arundinacea).3 In 2017, Oregon growers produced over 600 million pounds of cool-season grass seed crops consisting of over 950 varieties across eight grass species. The Willamette Valley has nearly 400 seed conditioning plants to clean and package the seed for market once the harvest is complete.

    Oregon growers are widely recognized for their expertise in seed production and most national and international seed companies have operations located in the Willamette Valley. Many of these seed companies have breeding programs with research and development facilities (Figures 3 and 4). Did you know that it can take up to 20 years to develop and release a new cultivar that produces true-to-type progeny from seed? Cultivars that prove to have traits that are measurably distinct, uniform and stable may be granted a plant variety patent and become a named variety.

    Breeding programs often conduct grower yield trials to screen potential new cultivars prior to publicly releasing them to ensure they produce acceptable seed yields. It doesn’t matter how good the variety a seed company develops is if the resulting plants don’t yield a commercially viable seed crop. Multiple breeding efforts today are focused on developing more sustainable turfgrass and forage varieties that perform well with less water and fertilizer while tolerating higher thresholds of heat, drought and salinity.

    The temperate climate of the Pacific Northwest combined with the fertile soils of the Willamette Valley make it an ideal place to produce turfgrass and forage seeds. So the next time you walk through a park, watch your favorite sporting event played on grass or inspect vegetation on a construction site, there is a good chance that seed started its journey in the Willamette Valley of Oregon. 

References

  1. Allen JE, Burns M, Sargent, SC. Cataclysms on the Columbia: A layman’s guide to the features produced by the catastrophic Bretz floods in the Pacific Northwest. 1986. Pages 175–189.
  2. Orr EL, Orr WN, Baldwin EM. Geology of Oregon. 1964. Pages 211–214.
  3. Giombolina K. Grass Seed Industry. Oregon Encyclopedia, A project of the Oregon Historical Society, www.oregonencyclopedia.org/articles/grass_seed_industry.

About the Expert
Brian M. Free CPESC, CPSWQ, CPAg employs a holistic approach to solving many of today’s challenges in erosion control and stormwater management and has successfully helped clients across multiple market segments.

The Power of People

As we begin a new year, it’s important you begin by having the best resources possible. The greatest resource of all is people. In my last column I wrote about the about the power of you, as an individual. In this column I’ll address the importance of and power in building a community.


Think of it as the equation of “YOU + US = YOUS,” and YOUS is your network, crew, team, business unit, association, peeps or whatever you call your network or gang. It’s not about the name of the group, it’s about the makeup of the people and the positive power they possess — their skillsets, experience, education, resources, passion, purpose and yes, their networks. All these elements combine to create great opportunities for you and your family, organization and future. No one can or should have to go it alone. Those people who understand your purpose and pathway will make you and your organization smarter, stronger and more valuable so you stand out among the competition.
As we all know, people are unique, each with their own power, essence and value that makes them a one-of-a-kind asset. Their unique talents help determine their role and relationship with you. The possibilities are endless as they mentor, coach, advise, teach, manage, train or heal you as you progress on your journey. They may start out as a colleague, customer, competitor or committee member and become a trusted advisor and friend. Seek to understand them, so that regardless of your age, gender, race, position, education or economic level you can also help them on their journey.


The benefits to both parties are endless. There are obvious benefits: gaining valuable career advice, insights into the marketplace, competitive intelligence and introductions and access to “unreachable” individuals and stakeholders, data, and resources. The benefits aren’t limited to your professional life because you’ll build self-confidence, communication skills, a circle of peers and friends and different perspectives that will enrich your life.


If building a network and developing relationships are not your strengths, no worries. There’s plenty of ways to do it but most important is YOU have got to start somewhere. There are many options. Before you speak or meet face-to-face, do a quick online search for the person to learn about their background or connect via social media. Read an article they wrote or were interviewed for or listen to a talk they gave. There’s a zillion ways to connect and learn about people today. Check your trade and association publications. Just start somewhere. Find your common ground and don’t be afraid to share ideas or an article you think they will like, ask for help, point out your six degrees of separation, compliment them and then start connecting with them in a way that you feel most comfortable.


The more people you connect with and learn from the more valuable you are to yourself, your organization, family and others. Money and success are important but there is nothing more satisfying or results in greater happiness than living a meaningful and purposeful life with positive relationships. I am who I am and owe everything I have in my life to the people who have been and are a part of my journey. Who do want on your journey and who can you help on theirs?  


About the Expert
Judith M. Guido is the chairwoman and founder of Guido & Associates, a business management consulting firm in the erosion control and green industry. Guido can be reached at 818.800.0135 or judy@guidoassoc.com.

Incorporating Environmental Justice into Future Stormwater Decision-Making

Figure 1. Durham County, North Carolina environmental justice populations identified.

The United States Environmental Protection Agency (EPA) defines environmental justice as “the fair treatment and meaningful involvement of all people regardless of race, color, national origin or income, with respect to the development, implementation, and enforcement of environmental laws, regulations and policies.”1 Environmental justice emerged as a concept in the early 1980s as studies revealed that certain disadvantaged groups of the population, such as poor and minority groups, bear a disproportionate burden of environmental hazards.2 In 2022, the EPA opened its Office of Environmental Justice and External Civil Rights with the goal of providing communities with resources and other technical assistance on civil rights and environmental justice, engaging with environmental justice concerns and providing support for community-led action.3 But what does this have to do with stormwater management?

Hurricane Katrina stands as a stark example of the interaction between stormwater management and environmental justice. Racial disparities in areas affected by the storm made clear that historical infrastructure decisions and economic factors where land at lower elevations was occupied primarily by African-Americans were a significant reason that 70% of those most affected were Black.4 In the storms’ aftermath, a new pre-flood approach to stormwater management and its effect on vulnerable social groups is emerging.5 Until recently, the most common factors in stormwater infrastructure decisions included location, capacity, treatment, suitability, cost and other conventional engineering considerations. The changing physical and social climates on planet Earth now require that additional factors be considered in order to develop for an equitable and resilient future. With increasing calls for decision-making to include diversity, equity and inclusion, social and environmental justice are now important criteria in stormwater project selection. Similarly, improving resiliency to climate change and/or sea level rise is also paramount, as these issues disproportionately affect disadvantaged communities with aging infrastructure.

Figure 2. Project scoring rubric includes environmental justice criteria.


Environmental Justice and Stormwater
Stormwater infrastructure decision-making is rife with opportunities to incorporate environmental justice concerns. At the watershed planning level, multiple tools are available for identifying environmental justice populations to understand how stormwater projects, from infrastructure installation to stream restoration, will impact surrounding and downstream communities. Databases and maps are now available to identify vulnerable communities including Census Data, National Environmental Policy Act (NEPA) Data and the Climate and Economic Justice Screening Tool. These tools can be added to the typical engineering design tools to implement stormwater projects that consider more than water quantity and quality but look at their impact with a more holistic community approach. In fact, some communities are doing just that already. This applies to new developments as well as treating existing impervious areas. Identifying environmental justice communities can be a critical piece of stormwater management in the future. In fact, some communities are already using environmental justice in their decision-making process.


Durham County

Durham County, North Carolina has adopted four guiding principles for its stormwater program including: compliance, efficiency, resiliency and environmental justice. As the county develops its plans to meet the requirements of two separate state-mandated nutrient management strategies, these guiding principles will be central to its project selection rubric. The county is taking a two-pronged approach to addressing equity and environmental justice as it relates to stormwater by identifying overburdened and underserved populations within its jurisdiction and where possible prioritizing them for stormwater management activities. For the purposes of this, and consistent with the definitions used by the EPA, an “underserved community” includes those communities with environmental justice concerns or that have vulnerable populations. An “overburdened community” includes those communities with minority, low-income, tribal or indigenous populations, or geographic locations in the state that potentially experience disproportionate environmental harms and risks.6

Figure 3. Bioretention pond plans at middle school.


The county understands that many times the first affected — by flooding, water quality pollution and other drainage issues — are often the last to receive information and so it is taking steps to target educational outreach to overburdened and underserved members of its community. Using NEPA standards for minority, poverty and limited-English proficiency thresholds based on census data, the county identified “Environmental Justice Populations” (Figure 1) as the underserved and overburdened populations on which to focus its educational efforts. Recognizing that not everyone has access to the internet or a smartphone, educational efforts will include physical products and in-person events and include Spanish translations to maximize their reach in low-income, minority and non-English speaking areas of the county.


Furthering their commitment to environmental justice, Durham County also seeks to locate stormwater projects in areas with high populations of overburdened and underserved individuals. As the county developed a methodology for selecting stormwater projects to comply with two separate state-mandated nutrient management strategies, it included environmental justice/equity as a criterion in its project scoring rubric (Figure 2). Projects receive credit for environmental justice/equity based on census block data classifications for minority and/or low-income populations. The county’s first two stormwater projects, a bioretention pond at a middle school with an over 80% minority student body and a stream restoration running through a mobile home park, both scored maximum points in this category. These projects are scheduled to begin in 2024 and 2026 respectively (Figures 3 and 4).

Figure 4. Stream restoration in mobile home park.


Conclusion
Incorporating environmental justice principles into stormwater decisions plays an important role in assisting underserved and overburdened communities who have long dealt with flooding, drainage and water pollution concerns, oftentimes literally in their backyard. The tools are available to add environmental justice and equity to the traditional engineering tools for new stormwater infrastructure design and placement, whether for new development or treating runoff from existing impervious surfaces. Durham County is only one example of how local governments can include environmental justice in their policies and project identification process.

References:

  1. EPA Environmental Justice Website: www.epa.gov/environmentaljustice.
  2. Holifield R. 2012. “Environmental justice as recognition and participation in risk assessment: negotiating and translating health risk at a superfund site in Indian country.” Annual Association of American Geographers. 102:591–613.
  3. EPA Environmental Justice Website: www.epa.gov/environmentaljustice.
  4. Morse R. 2008. “Environmental Justice Through the Eye of Hurricane Katrina.” Joint Center for Political and Economic Studies Professional Paper. p. 3–4.
  5. Meenar M., Fromuth R. & Soro M. 2018. “Planning for watershed-wide flood-mitigation and stormwater management using an environmental justice framework.” Environmental Practice, 20:2-3, 55-67.
  6. EPA Environmental Justice Glossary: https://www.epa.gov/environmentaljustice/ej-2020-glossary.


About the Expert
Ryan D. Eaves, PE, CFM, CPESC, is the Stormwater and Erosion Control Division Manager for Durham County in Durham, North Carolina. A native of Athens, Georgia, Ryan holds a bachelor’s in environmental science from Virginia Tech and a Master of Public Administration from the University of Georgia. He has over 17 years of local government stormwater and erosion control experience.

Micronutrient Soil Chemistry as a Strategy for Outcompeting Weeds

Figure 1. Application of fertilizer to the “cheatgrass pasture” at a ranchland site in Montana, May 2019 at the beginning of the growing season.

Soil forms over great periods of time under the influence of parent material, climate, topography and biology. The biological component is comprised of a vast number of soil organisms and responsible for mobilizing and sharing nutrients, degrading organic residues and fueling carbon exchange at the root interface. Much of North America was partially glaciated or ice-covered 15,000 to 50,000 years ago which led to soil development after the ice receded. The grassland soil inherited from millennia of edaphic processes is the geologic legacy of microbially degraded mineral matter and cycling of carbon and nitrogen.

As companion grassland plant communities developed, they reflected the novel chemistry of unique parent material and slow weathering. With the conversion of native prairie to cropping systems, endemic nutrient cycling was replaced by annual fertilization programs to maximize crop yield and petrochemical-derived herbicides to control invasive plants. Weeds also thrive on disturbed sites and on reclamation projects where nutrient cycling is disrupted to favor invasive plants.

Figure 2. 20×50 cm vegetation cover frames showing typical untreated (Top) and treated plot (Bottom) conditions in the second growing season (2020). The untreated plot is dominated by cheatgrass (yellow vegetation) while the treated plot is dominated by perennial grass (green vegetation).

Every plant species has unique nutritional requirements, sometimes narrow, sometimes broad. Cropping systems are dominated today by specialty plants bred and engineered for maximum productivity and their growth is accelerated by high application rates of macronutrients nitrogen, phosphorous and potassium. These introduced species and their plant-soil systems are vastly different from both the diverse plant communities and complex soil chemistry that preceded them where native plants were in relative equilibrium with climatic conditions and mineral soil weathering. At construction sites and reclamation projects we aspire to restore these same natural processes where low maintenance perennial and dominantly native plant communities are in geochemical and biological equilibrium with growth media that may be appreciably different to the pre-disturbance site.

Unfortunately, site disturbance may inadvertently create soil nutrient levels suitable for persistent weed growth rather than seeded species. Late successional perennial grass species are common to revegetation seed mixes and thrive in high quality and nutrient-rich soil rarely available at construction sites. The practice of seeding late successional desirable species into soils not suited to their development often results in poor germination and poor growth while invasive plants become established instead. Inadvertently, we may construct soils suitable to the weeds and not the seeded species, resulting in herbicidal treatment of weeds post-construction that may be both costly and ineffective.

Weed seeds are adapted to germination in many disturbed environments and particularly in low fertility growth media such as subsoil. Practitioners are aware that good quality soil resources are key to seeded species establishment and avoidance of invasive plant pressures, however high-quality soil may be lacking at construction sites leading to use of alternative growth media that may be biogeochemically dissimilar to the pre-disturbance soil and/or what is needed for late successional species. Steep slopes and other factors contribute to the difficulty of soil replacement. Soil may also be locally thin or not salvageable, or good quality soil may degrade after stockpiling and replacement.

Weeds may provide some soil stabilization, but commonly are disallowed under permitting requirements and especially if they are state-listed noxious weeds. Weeds such as cheatgrass may also worsen vegetation flammability leading to more perilous fire hazard. In soil with low organic matter and low micronutrient levels weeds may be very persistent and seeded species likely present only at low levels.

Ironically, many of the nutrients necessary for plant growth are present in the soil as geologic mineral matter but are unavailable to plants because they must be mobilized (e.g. dissolved) through biological processes resulting from organic acid dissolution of the mineral soil. Absent adequate organic matter, macronutrients and micronutrients may be lacking due to reduced biological activity. Nitrogen is the primary nutrient required by plants yet is the only nutrient that comes from biological activity and not from the mineral soil. Nutrients such as phosphorous, potassium, sulfur, calcium, magnesium, iron, copper, zinc, boron, molybdenum, manganese and chlorine all come from the mineral soil and are made available by microbial mobilization.

Figure 3. Perennial grasses are dominant in the treated portion of the pasture in July 2023. Thickspike wheatgrass is the dominant native perennial grass.

What harm could result from low levels of mineral nutrients found only at trace levels in soil anyway? Weeds. And to make matters worse, these invasive plants may be present for long periods of time as self-perpetuating plant cover.

Research has shown that fertilization with micronutrient dominated fertilizer products such as NutraFix® can result in a dramatic increase in perennial native grass cover in weed-prone sites. Two examples are presented, one from Montana (Figures 1, 2, 3, 4) at a rangeland site used for livestock grazing and the other from a mineland reclamation site in Colorado (Figure 5).

In both cases, cheatgrass was the dominant invasive plant either in the existing pasture (rangeland site) or immediately adjacent to the project (mine reclamation site). The rangeland site was dominated by cheatgrass (Downy brome) and had been for many years. A map of the ranch identifies the site as a “cheatgrass pasture” with low grazing value. Changing the soil fertility regime to a more micronutrient-rich condition shifted the plant community composition from annual grass dominated to perennial grass dominated without seeding.

In the Colorado example mine reclamation activities resulted in extensive regrading on a steep slope. The reclamation plan employed native grass seeding, micronutrient fertilization and BMP installation. Of particular concern was the prevalence of weeds and weed seed on the site prior to regrading and immediately adjacent to the project.

Figure 4. Perennial grass vegetation cover and annual grass cover following five years of monitoring post-treatment showing reestablishment of perennial grass dominance following fertilization.

The effects of fertilization on the ranchland example and conversion to perennial vegetation dominated pasture have endured five growing seasons after a one-time application while the mine reclamation project is in its third growing season following seeding. The ranchland site was approximately 20 acres (8.1 ha) while the mineland reclamation site was 3 acres (1.2 ha). In both cases the change in soil chemistry driven by micronutrient fertilizer addition resulted in dominance of the seeded species rather than weeds.

Invasive plants are a prevalent and seemingly unavoidable part of revegetation projects that may have a major effect on successful project outcomes including erosion. Designing soil micronutrient fertility to promote seeded species growth is a novel and powerful strategy in improving revegetation and avoiding project maintenance. Improved soil health through creation of nutrient-dense soil suited to the seeded species is a compelling strategy for outcompeting weedy invaders under improved fertility conditions designed to mimic late successional grasslands.  

Figure 5. A chronological sequence of the mineland reclamation project site showing the start of the first, second and third growing seasons. Seeded species were primarily native grasses.

About the Expert
Stuart Jennings has a Master of Science degree in land rehabilitation and more than 30 years of experience in disturbed land reclamation. He is the founder of start-up company Edaphix, which is committed to developing soil health-based methods of reducing or eliminating invasive plants at reclamation sites, on rangelands and in turfgrass.

Research Preview: Applying Sustainable Design Principles to Temporary Erosion and Sediment Control

Figure 1. Map of states responding to survey.

Since 1992, the Clean Water Act has required construction sites to obtain a permit that includes the development and implementation of stormwater pollution prevention plans (SWPPPs) to identify and mitigate potential pollutants prior to offsite discharge.1

During earthwork construction, bare soil is continually exposed and manipulated, leaving sites susceptible to rainfall-induced erosion. Consequently, sediment is the primary potential pollutant of concern during construction, which is mitigated through a temporary erosion and sediment control (ESC) plan.

These plans include the design, installation and maintenance of site erosion and sediment control practices, such as rolled erosion control, sediment barriers and ditch checks throughout construction phasing, and the plans must comply with the local, state and federal stormwater permitting requirements.

As a result, the material, installation, quantity and investment required by ESC plans are locationally variable. Once construction projects have reached final stabilization, ESCs are supposed to be removed prior to permit termination; however, these temporary practices are often forgotten once construction is completed.

In recent years, there has been discussion about the quantity of synthetic materials such as silt fence and plastic reinforcement netting used for ESCs that often persist in the environment long after construction is completed.2,3,4 While there is a need to practice good ESC measures for soil and water conservation, it is important to do so responsibly and not create an additional source of pollution.
The United States Fish and Wildlife Service has highlighted the negative impacts that abandoned ESCs can have on the environment and wildlife it supports, including wildlife entanglement, ingestion and degradation into microplastics.3 In the United States, state departments of transportation (DOT) are major facilitators of construction and maintain a set of ESC standards, and federally, the United States DOT has prioritized climate and sustainability.5 As a result, several states have shifted to prioritizing the use of natural ESC practices such as slash mulch berm and wattles in their SWPPS, over traditional synthetic practices.4,6,7

The objective of Oklahoma State University’s research is to compare the costs and environmental impacts of common ESC practices and use these metrics jointly to inform quantitative sustainable design in erosion and sediment control. To do so, a survey was distributed to 50 state DOTs to quantify the gaps related to the frequency of use and the investment in common ESC materials including silt fences, wattles and riprap in various ESC applications.

In addition, a life cycle assessment (LCA) is being conducted to identify the environmental impact of commonly used synthetic and natural-based practices from cradle-to-gate, which covers the time from resource extraction to production to delivery to store. These analyses will be combined to examine sustainability in the ESC design. The results from this study are anticipated to guide resource allocation and prioritization in ESC planning, implementation and research.

In 2022, the U.S. DOTs were contacted via an online survey to respond to questions about their stormwater permits and ESCs used by their respective agencies in the previous year. After providing survey consent, participants were asked four general questions about their permitting, inspections, cost and percentage of project cost spent on stormwater management.

The next two questions prompted participants to report on the average bid cost and quantity of different erosion and sediment controls used by their DOT. Responses including cost, quantity and units were left as open response and were standardized to a single unit for analysis. Sixteen states responded to the survey with varying participation for each question (Figure 1). DOTs from states that oversee their own permits reported 100 to 200 active construction stormwater permits in 2021. From the collected responses, construction stormwater contributed 2.7% of the total project cost. Additionally, the cost and quantity of sediment control systems including silt fence, wattle and riprap, were collected, as they can be used in several applications.

Overwhelmingly, states reported that silt fence is most widely used. States reported that seeding and mulching was the most common erosion control; however, four states also reported common use of rolled erosion control products. Presumably, rolled erosion control products were selectively used due to higher installed product cost compared to seeding and mulching.

Once costs were collected (Figure 2), the Iowa DOT and Oklahoma DOT standards and approved product lists were used to inventory the materials and quantities used in different ESCs. To enable comparisons between practices, system boundaries were created as follows:

  • 100 feet (30.48 m) run of perimeter control.
  • 8 feet (2.45 m) bottom width trapezoidal channel with 3:1 side slopes.
  • 1 acre (0.40 ha) for erosion control.
Figure 2. Reported spending on erosion and sediment control.

The ESC materials for each system were identified using LCA software, Simapro, with the ecoinvent and U.S. Life Cycle Inventory databases (USLCI). The ecoinvent database was specifically selected because it spans the areas of energy supply, agriculture, construction materials, textiles and metals. The materials were examined as a system process to assess the environmental impacts from cradle-to-gate. Transportation was not included in the LCA, because construction sites vary in distance and accessibility from ESC distribution centers.

Once the material systems were identified, we used the Tool for the Reduction and Assessment of Chemical and other environmental Impacts (TRACI) to assess the environmental impacts. TRACI is a midpoint-oriented life cycle impact assessment methodology developed by the U.S. Environmental Protection Agency. The impact categories assessed using TRACI included ozone depletion, global warming, acidification, eutrophication, tropospheric ozone formation (smog), ecotoxicity, fossil fuel depletion and land use effects.8 A functional unit of 1 kg or 1 foot was used depending on appropriateness, to determine the impacts associated with each material.

The environmental impact was then normalized according to the quantity of material needed for a practice that was consistent with the study’s system boundaries. To assess the total impact of a practice, all the materials’ environmental impacts were added. For example, a silt fence perimeter control would include geotextile, stake (e.g., steel or wood), reinforcement and cable ties.
This research is ongoing. The goal is to inform quantitative sustainable design in ESC to promote responsible resource allocation and design.  
References

  1. USEPA (1992). Final NPDES General Permits for Storm Water Discharges From Construction Sites. Federal Register Vol. 57 No. 175.
  2. USEPA (2022). BMP Fact Sheets. National Menu of Best Management Practices (BMPs) for Stormwater-Construction. Accessed July 2023. https://www.epa.gov/npdes/national-menu-best-management-practices-bmps-stormwater-construction.
  3. U.S. Fish and Wildlife Service (2022). Wildlife and Environmentally Friendly Erosion Control Materials. FWS.gov. Accessed July 2023. https://www.fws.gov/sites/default/files/documents/WLfriendlyErosionControl__final.pdf.
  4. Smith, C. and Letee, P. (2019). Plastics (synthetic fibers) in Erosion Prevention & Sediment Control Practices. October 3rd, 2019. Presentation. Accessed July 2023. https://www.house.mn.gov/comm/docs/d402ee9b-6c91-4955-bfc4-d141f1433ce1.pdf
  5. U.S. DOT (2023). Climate and Sustainability. Transportation.gov. Accessed July 2023. https://www.transportation.gov/priorities/climate-sustainability.
  6. Metz, V (2016). Wildlife-Friendly Plastic-Free Netting in Erosion and Sediment Control Products. Water Quality Factsheet for Permit Applicants. California Coastal Commission.
  7. University of RI, RI DOT, and RIDEM (n.d.). Soil Erosion, Runoff, and Sedimentation. Construction Site Fact Sheets.
  8. PRé Sustainability (2020). TRACI 2.1. SimaPro Database Manual Methods Library. Version 4.15.

About the Experts

  • Cheyenne N. Mata, M.S., is a graduate student in the department of civil and environmental engineering at Oklahoma State University.
  • Jaime C. Schussler, Ph.D., CPESC, is an assistant professor in the department of civil and environmental engineering at Oklahoma State University.

MOST POPULAR