74.1 F
Denver
Thursday, July 31, 2025
Advertise with IECA!
Home Blog Page 4

Floating Islands in Dubuque’s Bee Branch Creek

Located along the banks of the Mississippi River, the City of Dubuque, Iowa, USA, has a long history of dealing with flooding, particularly in the Bee Branch Watershed. The 7-mile2 (18.1-km2) watershed is where over 50% of Dubuque’s residents either live or work.
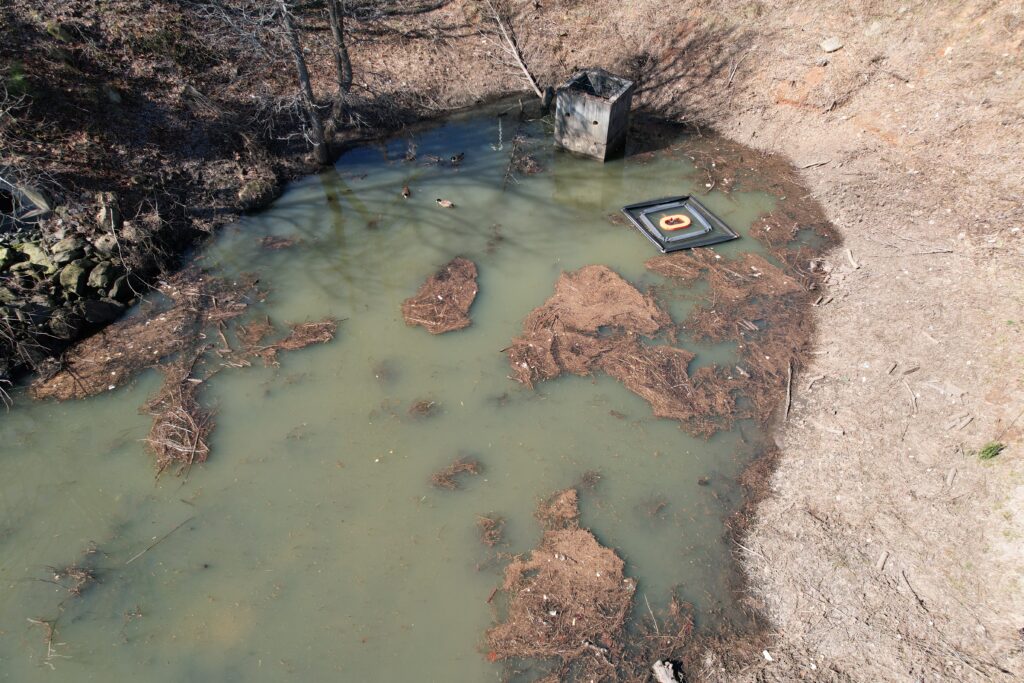
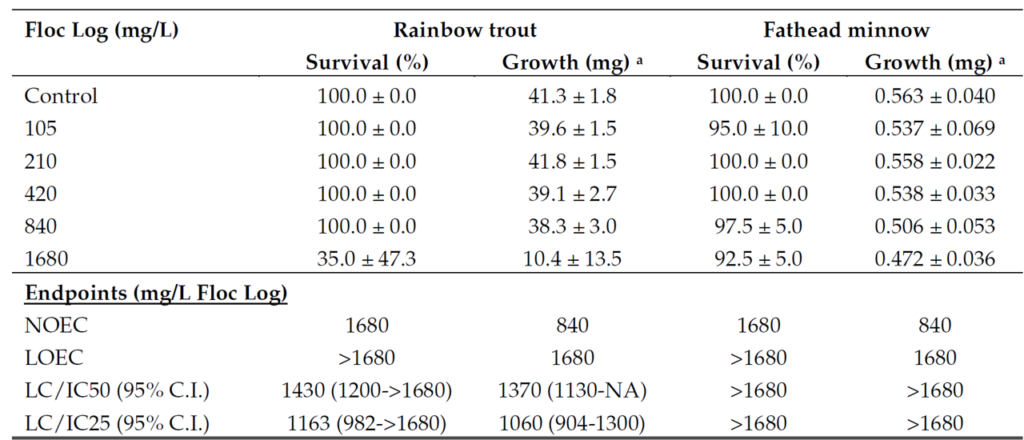
Flash flooding repeatedly impacted 1,300 homes and businesses in the flood-prone area — filling basements with water to the ceiling joists and, ironically, starting fires; ripping up pavement and blowing up storm sewers; knocking people off their feet when trying to cross the road and rendering cars in the street inoperable. To address the flooding, the city embarked on an ambitious project to daylight the Bee Branch, a forgotten creek buried in a storm sewer a century ago. One of the innovative elements of the creek restoration project was the installation of floating islands within the creek (Figure 1).

Figure 1. Anchored floating islands with driftwood and varied plantings.


Floating islands can serve multiple functions. They can help reduce erosion and sedimentation, improve water quality, create aquatic habitat and serve as an educational tool. As a physical barrier, the floating islands dissipate wave energy and help protect the creek shoreline. As water flows around the floating islands, the velocity is decreased, allowing suspended sediments to settle out and help to maintain water clarity. The plants on the islands absorb nitrogen and phosphorus from the water, preventing them from contributing to the dead zone in the Gulf of Mexico.


The roots and island structure support the growth of biofilms — communities of microorganisms that further break down pollutants and improve water quality. The roots extend into the water, creating a structure where fish can find shelter from predators and harsh environmental conditions, providing a safe space for young fish to grow and thrive. The roots and vegetation also create habitats for various invertebrates, including insects and crustaceans, which are critical components of the aquatic food web.


Additionally, the islands offer surfaces for birds to rest and potentially nest (Figure 2). Finally, the visibility and uniqueness of the Bee Branch floating islands have sparked interest, engagement and conversations about environmental stewardship, fostering a community-wide appreciation for natural solutions to ecological challenges.

Figure 2. Blue Heron resting on a floating island in the spring of 2024.


The 14 islands were designed as small micro-habitats reflective of the archipelagos found in the Mississippi ecosystem. Four prototypical islands were created with different shapes and sizes that varied from 70 to 300 feet2 (20 to 90 m2). They were sited along the Bee Branch in strategic locations for functionality, visibility and aesthetic enhancement. Planted with native vegetation, pieces of driftwood were hand-selected and placed on the islands to provide a year-round structure and habitat reflective of the region’s wetland and shoreline biomes. The design also included fencing around the perimeter to protect the emergent vegetation on the islands from waterfowl (cover photo).
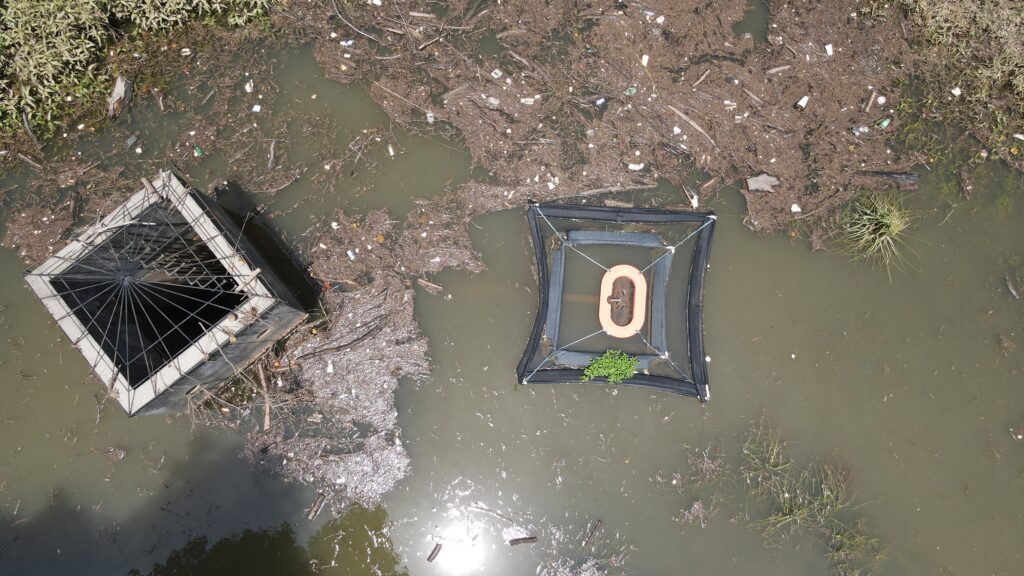
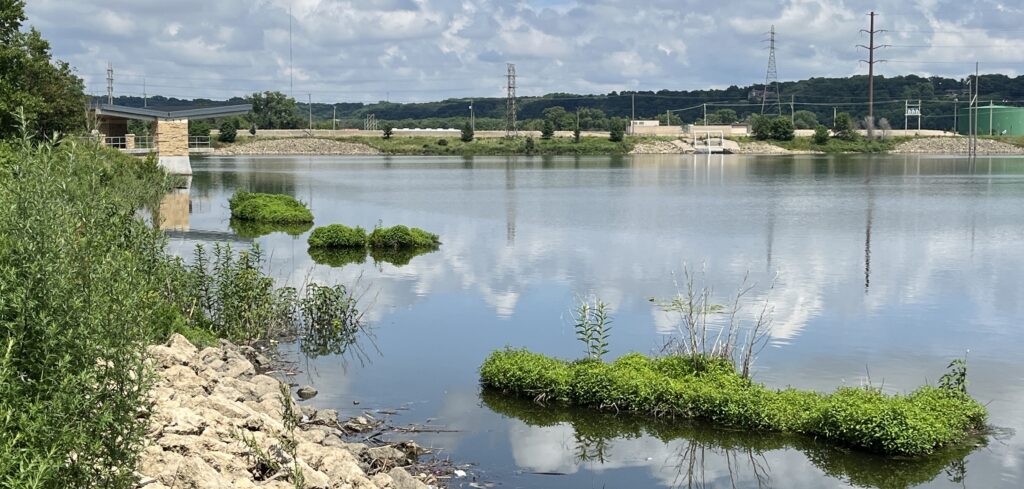
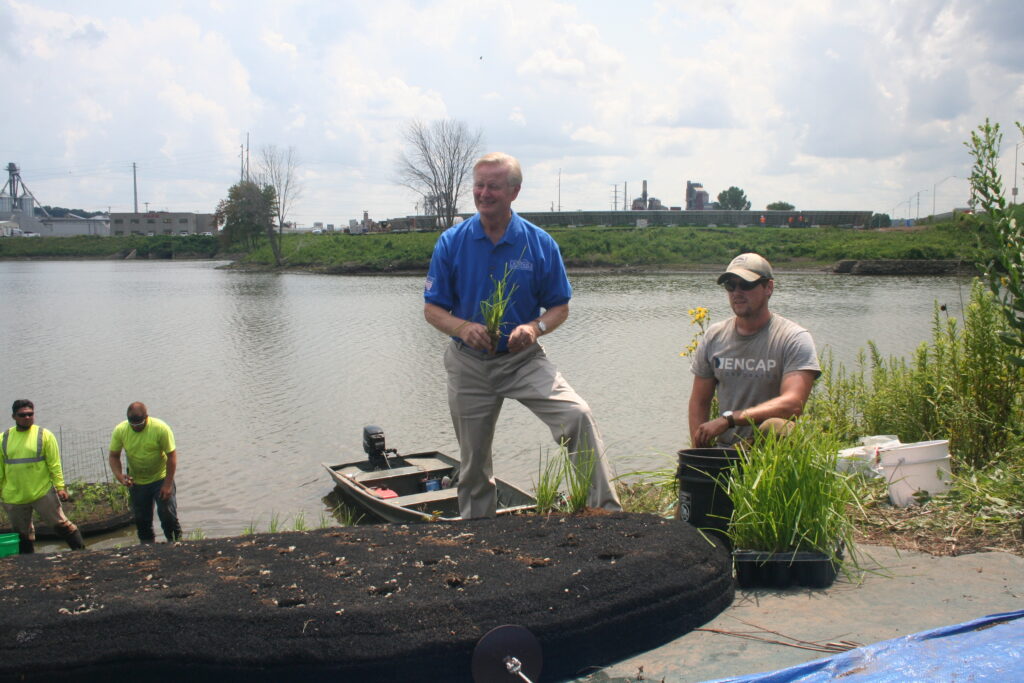
The main body of the floating islands was manufactured using approximately 67,000 recycled water bottles that don’t contain Bisphenol A (BPA). The islands were assembled, planted and installed in the fall of 2017. They were then anchored to the bottom of the creek using stainless steel cables, allowing them to move with fluctuating water levels and flow directions. Having promoted the event, with media present, City of Dubuque Mayor Roy Buol was present on-site during the assembly of the islands and personally rode in the boat transporting the islands to their designated anchoring spots in the creek (Figures 3 and 4). The total cost of the project was $176,000 and was funded in part with grants and donations.


Maintaining the floating islands is crucial to their long-term effectiveness and sustainability. Regular inspections are conducted to assess buoyancy, plant health and the integrity of anchoring systems. In 2019, an inspection revealed that most plants were thriving, although some replanting was necessary due to animal interference. Fencing repairs were also needed to protect the plants from geese.

For communities considering the implementation of floating islands, several factors should be considered:

  • Site selection: Choose locations with a minimum water depth of 2-feet (0.6 m) to prevent the roots from growing into the creek bed, full sun exposure and areas where water quality improvement is a priority. Ensure that the sites can accommodate the intended number and size of islands.
  • Design and materials: Collaborate with experts to design islands that mimic natural habitats. Use materials that support plant growth and withstand environmental conditions, such as recycled BPA-free polyethylene terephthalate (PET) plastic for the island matrix. Select native plant species that thrive in aquatic environments and have deep-rooted structures for nutrient absorption.
  • Construction and installation: Plan the construction and installation during optimal weather conditions. Ensure proper anchoring systems are in place to handle water level fluctuations and flow variations. Anchoring systems should be comprised of stainless steel to avoid corrosion. Multiple smaller islands are often more effective than fewer larger islands as they are easier to launch and anchor.
  • Maintenance: Regularly inspect the islands for buoyancy, plant health and structural integrity. Address issues such as plant loss and fencing repairs promptly. Use UV-resistant materials and reinforce fencing as needed to protect plants from wildlife.
  • Cost and funding: Seek funding through grants, donations and public-private partnerships. The long-term benefits of improving water quality and creating aquatic habitat and aesthetic enhancements can justify the expense.
  • Community involvement: Engage the community through public education and outreach programs. Highlight the ecological and aesthetic benefits of the floating islands to garner public support and participation.
  • The floating islands in Dubuque’s Bee Branch Creek are a testament to the city’s commitment to innovative and sustainable flood mitigation and environmental restoration. By incorporating these multi-purpose islands into the daylighting project, Dubuque not only addresses its flooding challenges but also enhances the ecological health of the watershed and the Mississippi River. This project serves as a model for other communities facing similar challenges, demonstrating the potential of nature-inspired solutions in urban environments. By considering site-specific factors, engaging experts and maintaining the islands effectively, other communities can replicate Dubuque’s success and enjoy the multifaceted benefits of floating islands. 


Note
The City of Dubuque would like to thank project partners Strand Associates, Saiki Design and ENCAP for their vision and expertise in helping to make the floating islands a reality.


About the Expert

Deron Muehring is the director of the City of Dubuque’s Water & Resource Recovery Center. He led the design effort on the $160 million Bee Branch Creek Restoration Project. He holds a bachelor’s degree in physics from St. Cloud State University and a master’s in environmental engineering from Marquette University.

Leveraging Solar Farms for Growth of Biocrusts

Figure 1. The solar farm used for the development of crustivoltaics in Mesa, Arizona, USA after a rain event. Photo credit: Ana Mercedes Heredia-Velásquez.

Deserts are commonly thought of as dusty places because they often are. An inherently sparse vegetation cover makes soils of arid lands more prone to wind erosion and a source of fugitive dust when winds pick up than their counterparts of greener pastures. This form of particulate atmospheric pollution is not only a common nuisance but also a pervasive public health risk to the ever-expanding population centers of arid lands.


Airborne dust loads in desert areas are significantly enhanced by certain forms of land use that include agricultural and other practices that trample the soil surface. Native desert biomes are only a very minor source of dust compared to adjacent cultivated areas under similar climate and meteorological conditions.1


One reason behind this marked difference is that native, pristine deserts harbor a natural, self-sustaining, live suit of armor: biological soil crust or biocrusts. These are communities of microorganisms that rely on photosynthesis to grow on the very top surface of desert soils, weaving soil particles together into a cohesive wind resistant cover.2 Much has been learned during the last 50 years about the ecology of this miniature, cryptic ecosystem and about the biology of the organisms that inhabit it.


Biocrusts are able to withstand extremes of desiccation, insolation and abrasion and to thrive in a sorely nutrient-poor environment. But biocrusts have an Achilles’ heel: they are brittle when dry and hence sensitive to trampling. Cattle grazing, plowing, vehicular traffic and construction all severely, even catastrophically, impact biocrusts. So much so that in vast desert expanses that now support intensive land use and were once presumably heavily colonized by biocrust, only biocrust remnants in a few untouched places remain at this point.
Scientists saw an opportunity to apply the knowledge gained towards the interventional restoration of arid soils, taking advantage of the many ecosystem services beyond erosion control that biocrust provide, including soil fertilization through carbon and nutrient drawdown from the atmosphere.3 The combined efforts of many trailblazing scientists all over the world, eventually resulted in a new kind of restoration practice that involves microbes, lichens and mosses, rather than plants. The practice involves microbial nurseries rather than tree nurseries. And yet, for all the technological advances on how to cultivate biocrust organisms in the lab or on nurseries,4 how to avoid biocrust pests,5 how to best re-introduce inoculum in the wild6 and how to promote its survival in the field,7 soil restoration through biocrusts remained an approach that required significant expertise and time investment. This limited the target footprint for application to pilot scales that reached a few hundred square meters in the best cases.


Crustivoltaics is a new approach designed to solve the scale constraints in biocrust restoration.8 The approach is based on the finding that the rows of elevated photovoltaic panels of solar farms create a milder microclimate in and over the soils that they cover, allowing much faster and more robust growth of biocrusts. Research has quantified the effect with the existing cover and biomass of biocrust under panels of a solar farm in Mesa, Arizona, USA with biocrust growth greatly exceeding that of uncovered, neighboring soils with similar climate and soil characteristics.


Other data shows that biocrusts under solar panels are no different in microorganismal composition from the natural, local biocrusts that grow without panel cover. In crustivoltaics, solar farms can serve as expansive, already existing biocrust nurseries that can produce the desired inoculants without much effort and at large scale.9 Importantly, crustivoltaics can be operated in a continuous mode, since experiments showed that harvesting biocrusts resulted in speedy recoveries as long as a small level of re-inoculation of harvested plots were carried out.


Following a rain event at a solar farm where crustivoltaics is being developed, incipient biocrusts on the soil, as well as areas that have been experimentally cleared of biocrust, and quadrats that have been re-inoculated, are obvious on the wet soils. The green-pigmented cyanobacteria migrate up to the soil surface from their refuge a few sand-grains below it10 to take advantage of optimal conditions for photosynthesis and growth (Figure 1).


A couple of climatically typical years are enough to bring biocrusts to original cover and biomass levels if the harvested areas are reinoculated to some 10% of the harvest. The remaining 90% can be used to inoculate restoration target soils outside of the solar facility in the neighboring area. Principally, biannual harvests are possible from a single source.


Crustivoltaics can increase capacity by orders of magnitude, which should suffice to reach regional scales. Researcher calculations show that the use of only the three largest solar farms in Maricopa County, Arizona as biocrust nurseries would enable a small-size business to restore the biocrust of all fallow agricultural lands in the county, which represents over 70,000 hectares (172,974 acres), in fewer than five years.
Important to this solution is that it offers additional economic and ecological incentives to solar farm operators to become active stakeholders by decreasing the load of wind-blown dust over panels, which is detrimental to energy output, and adding value to operations through production of goods (inoculants) and carbon credits (increased carbon draw-down by new biocrusts). The technology relies heavily on local solutions such as using a solar farm to restore soils in the surrounding landscapes that share soil types and climate. Local communities are thus primary stakeholders and main beneficiaries.


As a potential limitation, solar farms in geographical proximity to the restoration targets are a necessity to prevent maladaptation of the harvested biocrust to the target’s climate or soil properties. This may exclude truly remote areas from restoration. Researchers are currently working on technologies to expand the range of crustivoltaics to include restoration targets within similar climatic provinces but differing in soil composition.


Confirmatory pilot studies and initial deployment are currently being carried out or planned in central Arizona, a source of major dust pollution for the Phoenix Metro area because of long-term intensive land use, in collaboration with public state agencies and private solar operators. 


References

  1. Finn DR, Maldonado J, de Martini F, Yu J, Penton CR, et al. 2021. Agricultural practices drive biological loads, seasonal patterns and potential pathogens in the aerobiome of a mixed-land-use dryland. Science of the Total Environment 798:149239.
  2. Garcia-Pichel F. 2023. The microbiology of biological soil crusts. Annual review of microbiology 77:149-71.
  3. Rodríguez-Caballero E, Castro AJ, Chamizo S, Quintas-Soriano C, Garcia-Llorente M, et al. 2018. Ecosystem services provided by biocrusts: From ecosystem functions to social values. Journal of Arid environments 159:45-53.
  4. Nelson C, Giraldo-Silva A, Garcia-Pichel F. 2020. A fog-irrigated soil substrate system unifies and optimizes cyanobacterial biocrust inoculum production. Applied and environmental microbiology 86:e00624-20.
  5. Bethany J, Johnson SL, Garcia-Pichel F. 2022. High impact of bacterial predation on cyanobacteria in soil biocrusts. Nature communications 13:4835.
  6. Faist AM, Antoninka AJ, Belnap J, Bowker MA, Duniway MC, et al. 2020. Inoculation and habitat amelioration efforts in biological soil crust recovery vary by desert and soil texture. Restoration Ecology 28:S96-S105.
  7. Giraldo-Silva A, Nelson C, Penfold C, Barger NN, Garcia-Pichel F. 2020. Effect of preconditioning to the soil environment on the performance of 20 cyanobacterial strains used as inoculum for biocrust restoration. Restoration Ecology 28:S187-S93.
  8. Heredia-Velásquez AM, Giraldo-Silva A, Nelson C, Bethany J, Kut P, et al. 2023. Dual use of solar power plants as biocrust nurseries for large-scale arid soil restoration. Nature Sustainability 6:955-64.
  9. Garcia-Pichel F. 2023. Using solar farms as a platform for the ecological restoration of arid soils. Nature Sustainability 6, 891–892.
  10. Pringault 0, Garcia-Pichel F. 2004. Hydrotaxis of cyanobacteria in desert crusts. Microbial Ecology 47:366-373.

About the Expert
Ferran Garcia-Pichel, Ph.D., is a professor of microbiology at Arizona State University. He is interested in microbial adaptations, the roles microbes play to shape their environment, including translating this knowledge gained into practical applications, particularly in ecological restoration.

Self-sustaining Revegetation Program Based on Soil Science

Figure 1. Sandstone batter on a road project in Sunshine Coast, Queensland, Australia in October 2020 prior to remediation.

Traditionally, soil analysis has focused on chemical and physical properties, often overlooking soil biology’s critical role. Effective soil management influences the soil microbiome, affecting the ecosystem’s health and sustainability. Recognizing and managing soil biology is crucial for successful soil remediation and revegetation, especially considering past limitations.


In today’s rapidly changing environmental landscape, innovative, sustainable soil remediation, revegetation and erosion control methods are essential. EnviroStraw’s BioGrowth™ Program uses innovative soil science and analysis, advanced technologies and eco-friendly regenerative practices to cost-effectively transform degraded soils into thriving ecosystems. This program addresses ecological factors and constraints even in challenging environments, mitigating risks typically associated with unsuccessful revegetation projects.

A Revolution in Soil Science and Remediation
Effective remediation now requires a progressive strategy with a comprehensive biological understanding of soil science. Evaluating the complexities of degraded areas is crucial for assessing the effectiveness of rehabilitation efforts.


Remediation methods that only emphasize chemical amendments and physical treatments, can inadvertently neglect vital soil biological health, quality and balance. This oversight has drawbacks, as maintaining soil health and balance is crucial for preserving soil functionality and supporting resilient plant growth.


Impractical and Ineffective Application
Typical agricultural remediation approaches are often unsuitable for natural ecosystems restoration and are not always environmentally friendly. These approaches can disrupt ecological balance and fail to support biodiversity and ecosystem recovery essential for sustainability.1 These methods can also require substantial investment and inputs without necessarily yielding sustainable outcomes.


Potential Negative Effects of Excess Applications

  • Mineral lock-up/immobilization of essential mineral nutrients, reducing nutrient use efficiency (NUE) and resulting in limited availability to plants.
  • Increased volatilization, leaching and depletion that potentially pollute water, air and soil. Excessive nitrogen inputs waste resources and can cause soil acidification that further degrades soil quality.
  • Excessive liming can create nutrient imbalances that lead to deficiencies and toxicities that potentially harm soil health and plant growth. Excessive liming can increase CO2 and N2O greenhouse gas emissions (GHG).2
  • Disruption of microbial communities can occur with inappropriate use of soil amendments. They can inhibit vital soil biology-plant symbiotic processes, negatively affecting microbial community structure and diversity.3

Ineffective Soil Cultivation Practices
Increased soil bulk density, lack of structure, soil water repellency (SWR) and limited moisture infiltration and storage hinder deep-root development and plant growth when soil cultivation practices are ineffective.4


Elevated Levels of Weed Species
A less than comprehensive remediation program leads to inferior sowed seed strike rates, poor establishment and growth and the use of bio-incompatible agri-chemicals. Also, competition for nutrients can result in mineral deficiencies.


Compromised Soil Erosion Protection Practices
Adverse environmental impacts over prolonged periods that affect soil stability and health can be the result of compromised soil erosion protection.


The Need for Sustainable Practices
In contrast, the BioGrowth Program employs a comprehensive regenerative approach to address the biological, chemical and physical characteristics of soil. This balanced methodology enables tailor-made, precise and effective remediation and revegetation efforts, ensuring the restoration of healthy, thriving ecosystems.


The program integrates next-generation beneficial microbial inoculum technology into a soil remediation plan. Application of a multi-strain suite of beneficial bacteria and fungi enhances nutrient bioavailability and plant uptake.5 This technology also increases biological nitrogen fixation and soil carbon6 and can improve soil aggregation, stability and structure.7 Balanced microbial communities also help enhance water infiltration and retention, mitigate SWR and promote robust plant growth and resilience.8


Integrating controlled-release biomineral fertilisers (CRF) effectively addresses soil mineral imbalances and deficiencies while providing essential nutrients with minimal environmental impact.9 The base component of these fertilisers, which are manufactured from natural ores,10 utilize specifically inoculated beneficial microbes to mediate gradual release of nutrients, to boost NUE, promote microbial biomass formation and increase stable soil organic carbon,11 which leads to larger root growth and improved root architecture.9


Additionally, the use of slow-release nitrogen fertiliser, biological nitrogen fixation and enhanced phosphorus uptake efficiency in the rhizosphere reduces the need for large inputs of water-soluble nitrogen and phosphorus fertilisers.12 This approach minimizes the risks to water sources and environmentally sensitive areas. Enhancing soil fertility, nutrient bioavailability and increasing long-term stable total soil carbon, reduces the need for excessive application of conventional agricultural soil inputs. It also “biologically” addresses issues such as mineral lock-up, nutrient volatilization and leaching, while helping to reduce soil toxicity and mitigate GHG emissions.5,7,12,13


Employing “beyond best practice” regenerative revegetation methodologies, such as hydromulch with applied seed, can effectively address challenges associated with inadequate topsoil. Advanced eco-friendly hydromulching solutions made from waste derived from renewable and sustainable natural fibers, such as wheat straw, and integrated with biomineral and microbial technologies, enhance soil stabilization, moisture retention and seed germination.14 These straw-based hydromulch media are designed to rehabilitate disturbed and degraded soils, promoting successful revegetation. They improve soil health, support vegetative cover establishment in mine site rehabilitation and increase microbial biomass carbon, aiding in erosion control.6,7,8,11,14


A cornerstone of this revegetation program’s commitment to self-sustainability and the principle of the circular economy includes utilizing waste materials like wheat straw, biochar and recycled natural ores. These inputs enhance soil physicochemical properties, support microbial activity, increase soil carbon sequestration for recalcitrance and aggregate protection,6,7,11 erosion control and stabilization of minerals and heavy metals that are ideal for rehabilitating construction sites, mine sites and contaminated areas.13,14,15


Research and Innovation
Studies conducted by researchers at various universities and institutions have been crucial in helping develop the scientific foundation and technologies incorporated in the program.5,6,9,10,14 These studies explored the interactions between soil amendments, microbial activity, plant growth and carbon sequestration, providing valuable insights into the mechanisms of the program’s practices.


These advanced eco-friendly technologies enhance soil structure, fertility and plant performance leading to better water-holding capacity, soil stability and reduced erosion. The improvements support long-term ecological balance, climate mitigation, biodiversity enhancement, reduced carbon footprints and sustainable land management.


This regenerative program has proven effective in various projects, including roads, railways, construction, mine sites and pastoral lands. The program enhances microbial biomass, erosion control and metal uptake, which is crucial for commercial and mine site rehabilitation. For example, combining perennial ryegrass, biomineral fertiliser and wheat straw has improved soil health and plant establishment in iron ore tailings rehabilitation.


The combination of advanced soil science and analysis, recycled and sustainable inputs, and innovative technologies has produced a program that offers a transformative approach to soil remediation and revegetation. This program provides a comprehensive solution for rehabilitating degraded soils and promoting ecological balance, which is essential for a greener, more resilient future. 


References

  1. Ding et al. 2024. A Review of Life Cycle Assessment of Soil Remediation Technology: Method Applications and Technological Characteristics. Reviews Env.Contamination 262,4.
  2. Sanderman. Can management induced changes in the carbonate system drive soil carbon sequestration? A review with particular focus on Australia, Agriculture, Ecosystems and Environment, 2012 155,70–77.
  3. Zhong et al. 2010. The effects of mineral fertilizer and organic manure on soil microbial community and diversity. Plant Soil 326,511–522.
  4. Lee et al. 2014. Influence of amendments and aided phytostabilization on metalavailability and mobility in Pb/Zn mine tailings. J. Environ. Manage. 139,15–21.
  5. Tshewang et al. 2020. Growth and nutrient uptake of temperate perennial pastures are influenced by grass species and fertilisation with a microbial consortium inoculant. J. Plant Nutr. Soil Sci. 183,530–538.
  6. Strydom et al. 2022. A Case Study Demonstrating How Enhanced Beneficial Microbial Activity Builds Carbon and Balances Highly Disturbed Soils – IECA Australasia Conference Coffs Harbour 10/2022.
  7. Fan et al. 2022. The Underlying Mechanism of Soil Aggregate Stability by Fungi and Related Multiple Factor: A Review. Eurasian Soil Sc. 55,242–250.
  8. Adewara et al. 2024. Soil Formation, Soil Health and Soil Biodiversity. In: Aransiola et al. (eds) Prospects for Soil Regeneration and Its Impact on Environmental Protection. Earth & Environmental Sciences Library. Springer, Cham.
  9. Tshering et al. 2022. Microbial Consortium Inoculum with Rock Minerals Increased Wheat Grain Yield, Nitrogen-Use Efficiency, and Protein Yield Due to Larger Root Growth and Architecture. Agronomy 12,2481. 10.3390/agronomy12102481.
  10. Assainar et al. 2020. Polymer-coated rock mineral fertilizer has potential to substitute soluble fertilizer for increasing growth, nutrient uptake, and yield of wheat. Biology and Fertility of Soils 56,381-394.
  11. Zhou et al. Global turnover of soil mineral-associated and particulate organic carbon. 2024. Nature Commun 15,5329.
  12. Ghafoor et al. 2021. Slow-release nitrogen fertilizers enhance growth, yield, NUE in wheat crop and reduce nitrogen losses under an arid environment. Environ. Sci. Pollut. Res. 28,43528–43543.
  13. Adesemoye et al. 2008. Enhanced plant nutrient use efficiency with PGPR and AMF in an integrated nutrient management system. Can J Microbiol 54:876–886. Sarathchandra et al. 2022. Metal uptake from iron ore mine tailings by perennial ryegrass is higher after wheat straw amendment than wheat straw biochar amendment. Plant and Soil. Advance online publication.
  14. Golia, E. 2023. The impact of heavy metal contamination on soil quality and plant nutrition. Sustainable management of moderate contaminated agricultural and urban soils, using low cost materials and promoting circular economy, Sustainable Chemistry and Pharmacy 33,101046.


About the Expert
Paul Storer MSc, CPAg, is the senior soil microbiologist with Envirostraw, which is in Yarrawonga, Victoria, Australia. With over 43 years of extensive on-going experience in soil science research, fieldwork, farm management and revegetation best practice programs and numerous publications, he bridges the gap between academic research and tangible industry applications.

Hybrid Infrastructure: A Solution for Tomorrow’s Challenges

Figure 1. A high flow rate proprietary biofilter installed in a highly impervious right-of-way application treats the required water quality treatment volume. Excess flows are routed to the downstream inlet.

Gray, no, green! Green, no, gray! No, this is not the latest dress color controversy from nearly a decade ago. Instead, it is a common refrain heard among stormwater management practitioners when discussing water quality and water quantity infrastructure needs.


Green is green infrastructure (GI) which includes bioswales, bioretention cells, such as rain gardens, and other practices that mimic the natural hydrologic cycle through their pollutant removal processes. Gray infrastructure is more traditional storage and conveyance systems like pipe networks and hard channels that don’t allow runoff to infiltrate into the ground. As communities learn to adapt to future infrastructure needs related to climate change, particularly increases in storm volumes and frequency, both infrastructure types are necessary because existing research indicates that neither alone will fully address impacts.


Stormwater practitioners in areas already impacted by climate change are attempting to design stormwater systems that strike a balance between current and future stormwater needs, regulatory requirements and costs. Designing with these variables in mind is like forecasting the future. The challenge is evaluating whether a system designed today can meet tomorrow’s needs.

Figure 2. A high flow rate biofilter incorporating a recessed top planted with vegetation used in conjunction with storage meets existing regulatory requirements in the state of Maryland.


Green infrastructure is a commonly used compliance tool promoted as a best practice for addressing climate change impacts. However, GI may not be the sole answer to the problem. Emerging studies indicate that climate change poses significant risk to GI practices, specifically that GI will not be able to continue to effectively manage urban stormwater runoff under current design standards.1


If bioretention, which is considered the gold standard for GI practices, will be challenged to store and treat future runoff amounts, what about other structural best management practices (BMPs)? Can anything be done to bring more certainty to this very uncertain scenario? Optimizing the use of the full suite of currently available tools to provide treatment and volume capacity as well as reduce costs may help stem the coming tide.


Hybrid infrastructure offers a potential solution. Hybrid infrastructure is a compliance strategy that blends natural systems with conventional ones to produce adaptable, optimized BMP designs capable of achieving desired co-benefits.


A 2018 study published by the United States Environmental Protection Agency (EPA) concluded that “for overall post-treatment site-scale performance, simulations using both conventional and green infrastructure BMP scenarios generally remove more runoff volume and pollutant mass under future climate conditions (increased precipitation and runoff) compared to current conditions.”2 The study expands on that, stating: “GI practices that rely on treatment without volume storage will be at a disadvantage for climate change adaptation, but approaches that rely only on adaptation of conventional practices may not have the flexibility to address multiple performance objectives.”
In the EPA study, the hybrid infrastructure approaches varied between the modeled sites. A few combinations studied included infiltration practices and permeable pavement with a dry detention basin; distributed bioretention with a dry detention basin; and green roofs, permeable pavement and bioretention with an underground dry detention basin. While these are primarily examples of land-based, structural BMPs, the study’s conclusions also apply to project designs that utilize proprietary treatment practices, also known as manufactured treatment devices.

Mitigating increased runoff from new and redevelopment projects under future climate projections is a major obstacle. A critical design consideration involves addressing the creation of additional volume capacity while still effectively integrating it into the overall site design.

Biofilters Plus Storage as Solution
There is no one size fits all approach. In a surface-based application, a project designer may elect to increase the filter surface area of a bioretention practice or retention pond if land is available. However, on a space constrained site, such as a limited right of way (ROW) within a residential subdivision or other highly impervious sites, including redevelopment parcels, alternatives to conventional surface-based solutions are needed (Figure 1). To maximize co-benefits of GI in this example, an engineered high flow rate biofilter could be paired with an underground BMP infiltration gallery or detention system in a more compact footprint to meet the desired quantity and quality goals.
The upstream high flow rate biofilter provides flow-through treatment capturing pollutants such as sediment, nutrients, metals and trash at the source while the downstream system provides runoff reduction or peak flow mitigation (Figure 2). Since the high flow rate biofilter treats stormwater at higher media flow rates than traditional bioretention, it uses a smaller surface area to manage larger drainage areas and increased runoff volume thereby creating more usable space on-site.


Pollutants filtered out by the high flow rate biofilter are prevented from migrating downstream and are easily accessed for maintenance purposes. This sequestration has the added benefit of protecting the downstream infiltration gallery from premature clogging which extends the system’s useful life span. With system longevity increasingly gaining in importance as a design element, failing to consider the need to preserve in-situ infiltration rates could result in additional runoff storage volumes being regulated in the future if performance expectations go unmet.


Several areas of the United States already impacted by climate change have regulatory frameworks that support the used of hybrid infrastructure as a solution now and into the future. The State of Maryland’s Department of the Environment allows proprietary biofiltration to be designed in conjunction with infiltration components to meet required environmental site design compliance standards. Additionally, in Virginia Beach, Virginia, USA, new stormwater regulations passed in 2020 require design storm depths to use NOAA Atlas 14 plus 20% for BMP design and the city includes a mix of green and gray infrastructure within their own flood mitigation strategies to address that increase. These two examples are not all-inclusive, yet they establish a realistic baseline for what other communities can consider incentivizing hybrid infrastructure as a stormwater management tool.

Figure 3. A high flow rate biofilter used in a linear application in the Pacific Northwest United States.


It is reasonable to think that addressing climate change may automatically increase overall project costs. Installing BMPs with larger surface areas or using larger diameter pipe sizes sounds expensive. However, that may not always be the case. The basis of hybrid infrastructure is rooted in flexible designs.


In the earlier limited residential subdivision ROW example, the high flow rate media uses significantly less surface area footprint at a cost savings over a conventional, surface-based bioretention system. Different pipe materials can also be selected to lower costs further.
Amenities like new green space or additional parking stalls can be installed where a surface-based BMP would otherwise be located. Each value-added amenity may offset a portion of the required stormwater management costs. This concept is particularly prudent when considering linear retrofit projects with limited rights-of-way (Figure 3). High flow rate biofiltration systems can be installed in existing curb lines to treat the new impervious area while the additional runoff volume can either be accepted via the existing storm sewer network if capacity exists or be moved offline into a secondary pipe network to infiltrate or be slowly released back to the existing storm network over an extended period. Utilizing a hybrid infrastructure solution in this case would eliminate costs associated with purchasing land for the installation of a large surface-based stormwater detention facility.


Hybrid infrastructure is not a panacea for all future stormwater problems. However, it can address many concerns related to future water quantity projections and associated water quality issues. Incorporating pathways for hybrid infrastructure utilization today through flexible regulatory frameworks has the potential to mitigate tomorrow’s problems with a little planning now. Future communities will look back and thank us for proactively addressing this concern. 


References

  1. Tirpak RA, Hathaway JM, Khojandi A, Weathers M, Epps TH. 2021. Building resiliency to climate change uncertainty through bioretention design modifications. Journal of Environmental Management, Volume 287, 2021, 112300. Available online at https://doi.org/10.1016/j.jenvman.2021.112300 (https://www.sciencedirect.com/science/article/pii/S0301479721003625).
  2. U.S. EPA (Environmental Protection Agency). 2018. Improving the resilience of BMPs in a changing environment: urban stormwater modeling studies. Office of Research and Development, Washington, DC; EPA/600/R-17/469F. Available online at http://www.epa.gov/research.


About the Expert
Jacob Dorman is the regional regulatory manager for Contech Engineered
Solutions LLC.

Perimeter Control Alternatives to Silt Fence

Figure 1. Silt fence correctly installed at the base of road fill slope.

As a strong physical barrier to water and sediment, silt fence has long been the default best management practice (BMP) where there is an elevated risk for sediment erosion and discharge from a project (Figure 1).


Increasingly, finding alternatives to silt fence is recommended as the enormity of the negative environmental footprint of silt fencing is becoming clear. Because silt fence is not fully biodegradable or recyclable, and because its removal usually destroys it, most silt fence is landfilled at the end of the project or simply left on-site.


With these negatives, early assessment of a construction project and the available options to silt fencing might allow adequate control of runoff while avoiding the environmental costs of silt fencing.


Finding an alternative to silt fence has usually been limited to projects where physical factors complicate its use. For instance, the work might be on an impervious surface where silt fence cannot be installed, or construction might be in a sensitive area that would be damaged by the installation and removal of silt fence.


The perimeter control options that might be chosen for sites that are not appropriate for silt fencing can also be used in the place of silt fence in other sites as well. These options include:


Burlap Fabric
If a sensitive area needs to be delineated, such as a wetland or native plant restoration, and the project will not involve dirty water or sediment discharge into that area, burlap fabric can be used. Delineation fencing is easily installed by attaching the burlap fabric to wood posts. There may be no need to trench the fence into the soil, but if greater security is desired, leave a flap at the base and hold it in place with stakes, biodegradable straw, coir wattles or even chipped wood, compost or hog fuel. At the end of the project, the burlap fencing and any stabilizing materials can then be safely left to decompose in place.

Figure 2. Construction fence delineating work areas.


Construction Safety Fence
On many projects, silt fence is incorrectly placed along the top and sides of slopes. If the risk of erosion from the top and sides is minimal, construction safety fence is a better alternative. Construction safety fence is also a better alternative for delineating haul roads and staging areas. Because these applications do not require trenching into the soil, removal is easy. Although construction safety fence is not biodegradable, it is still a better alternative to silt fencing because it can be reused many times. (Figure 2).


Compost
If contractors have access to commercial compost, as we do in the Puget Sound region, and the site is small and flat, with minimal risk of sediment or dirty water discharge, compost berms work well. They contain the dirty water, allowing it to filter slowly before discharging clean water. At the end of the project, the compost can simply be spread on-site and seeded.

Figure 3. Asphalt berm separating clean from dirty work areas.


Asphalt Curbs and Berms
Asphalt curbs and berms are durable, recyclable and effective perimeter controls to use on impervious surfaces to keep clean runoff out of the work area or to contain site water. Extruded asphalt curbs can be utilized, as well as hot or cold mix berms.
Asphalt installed along the base of jersey barriers, a modular concrete or plastic barrier typically seen on road construction, also works well to contain or direct runoff. At the end of the project, the asphalt can be removed and recycled (Figure 3).


Concrete Curbs and Gutters
Phasing the project so that the permanent concrete curbs and gutters are installed as soon as possible often benefits the project by containing site water or redirecting off-site water away from the project. In addition, installing road base course and at least one lift of asphalt with the curbs and gutters creates a clean work and travel surface while site construction occurs, helping to prevent sediment track out.


Sandbags
Once asphalt for the parking or road surface is installed, stormwater runoff management will still be necessary. If the curbs and gutters or other conveyances are not complete, there could be places along the edge of the road surface where runoff could contact dirt and cause dirty runoff. Sandbags will work as temporary curbing to direct runoff away from bare soil. If you plan to use sandbags longer than thirty days, check to make sure they are ultraviolet (UV) stabilized so they don’t degrade in the sun.

Biodegradable Wattles
If the project entails planting or working around a wetland, consider using 100% biodegradable wattles. These can be filled with coir or coconut fiber, straw, compost or chipped wood held in tubes of burlap or other natural fibers. Be sure not to use wattles wrapped in plastic netting, as this will not biodegrade and could trap small reptiles and animals. Use wooden stakes to hold the wattles in place. It may be possible to leave the wattles to rot in place or remove and spread the biodegradable material on-site.


The environmental impact of defaulting to silt fence as a BMP is significant and increasingly is resulting in the use of alternatives to control sediment erosion and runoff at construction sites.


These are just a few of the alternative perimeter controls available. They can be combined and/or modified to meet specific project conditions. Engineers and contractors must always assess risk and address it appropriately, but they are encouraged to think out of the box that currently favors silt fencing. Once the best alternative is identified, be sure to modify the stormwater pollution prevention plan as needed. 


Resource
Additional perimeter control alternatives may be viewed at the Pacific Northwest Chapter of IECA’s YouTube channel: https://youtu.be/NxEqVnM7vd8.


About the Expert
David Jenkins, CPESC, has worked in construction erosion control for over 30 years. He retired in 2021, after 22 years as the Port of Seattle erosion control/stormwater engineer. His experience is in heavy civil, public works construction, primarily seaport, airport and roadway infrastructure.

Using Filtration in Basins to Meet Water Quality Requirements

Figure 1. Typical section of a dry detention pond.

In most areas, stormwater basins or ponds are the most common means of stormwater management. Basins have a proven history of being a cost-effective means of reducing the peak rate of discharge for developments to mimic pre-development conditions. Within the past 20 to 30 years, post-construction water quality has become just as important, if not more so, than quantity control, and methods of using basins to provide water quality have also begun to be implemented.


Traditional First-Flush Methodology
The most common method of providing water quality with a stormwater basin is the first-flush model. The first-flush model attempts to capture a standard runoff volume from the area draining to the pond and then slowly release that volume with the intent of allowing sediment and other pollutant particles to settle to the bottom of the basin before being discharged. The first-flush volume requirements vary from state to state but are generally 1 to 1.5 inches (2.5 to 4 cm) of runoff from the contributing area when draining to a dry detention or extended detention basin (Figure 1) and typically half of this volume when draining to a wet retention or extended wetland-type basin.

While the first-flush methods are widely accepted, there are several flaws with this design. One flaw is the release rate for the first-flush. It typically assumes that the entire first-flush volume instantaneously appears in the basin and is then drained over a specified time period, typically 24 hours. This is unrealistic as the pond will actually fill up over time as rainfall accumulates. This fallacy results in ponds being designed with a significantly larger volume than is actually utilized during a storm event that generates the first-flush volume of runoff.

Another flaw is that this methodology relies upon settlement created by ponding to achieve water quality. During small storm events, there is generally very little ponding as the flow will exit the pond nearly as quickly as it enters. Since the water quality is dependent upon settlement time, this results in very little to no treatment of small storm events, particularly in dry basins.


Finally, the discharge point for dry basins is generally located at the bottom of the pond, which is where the design concentrates sediment and other pollutants. Although a trash guard to minimize clogging should be part of the design, this does little to keep fine sediment particles and other pollutants from being discharged, especially when there is minimal ponding time or resuspension in a subsequent rain event.


Use of Floating Outlets
Floating outlets, also known as skimmers, have become the standard for sediment basins during construction and are widely recognized as significantly improving the trapping efficiency of the basin to greater than 80% of total suspended solids (TSS). However, skimmers are typically removed once construction is complete, and the ponds revert to a low-flow orifice to release the first-flush volume. One reason for this is that many skimmers are constructed of PVC. Because PVC is not UV-resistant and will weather, crack or break after a few years in the basin, it is not considered acceptable for permanent use. If skimmers were available that could be considered for permanent use, they could be a good option to function as the low-flow orifice, which would improve the TSS removal efficiency of basins.

Figure 2. Skimmer with 2-stage filter.


Development of Skimmer Filter
Over the past five years, Rymar Waterworks Innovations has been researching the use of skimmers to help meet post-construction water quality requirements. During the research, the concept of adding filters around the skimmer to provide cost-effective treatment of stormwater runoff was evaluated. The research involved the development of several prototypes and testing them in existing basins as well as controlled test tanks. It became apparent that the biggest challenge was to develop a filter that would provide adequate treatment and maintain the flow rate of the skimmer.


The initial prototypes use filtration media that fit closely to the skimmer and fully encapsulated the skimmer to ensure all flow went through the filter. Although the filter media had been tested to confirm flow rates, the force created by the skimmer to pull the flow through the media was insufficient, and the filters became the limiting factors. Many different types of filters were tested but a suitable media could not be identified.


Eventually, a larger filter that included a two-stage system was developed (Figure 2). The outer stage of the filter was constructed from a woven polyethylene filter fabric, which acted as a screen to remove debris and larger sediment particles. The inner filter was constructed of a non-woven geotextile with two layers of fabric. Slits were cut in each layer of fabric at 6-inch (15-cm) intervals, with the slits offset in the two layers. This facilitates flow through the fabric and increases contact time with the fabric to aid in the capture of fine particles and potentially dissolved particles. Both filters were constructed to have a 3-foot (0.9-m) depth from the water surface, which uses settlement/gravity to prevent sediment or pollutant particles from being discharged through the skimmer as the force of flow under the filter is not sufficient to pull the particles up 3 feet (0.9 m) to be discharged by the skimmer.


This prototype was placed in an existing basin and closely monitored for over two years. Although no sampling was done during this time, the discharge from the skimmer/filter system was noticeably less turbid than water in the basin. A time-lapse camera was installed to monitor the system during storm events and confirm the draw-down times remained consistent even after the filters began to accumulate substantial debris and sediment.


After two years of monitoring, the system was tested by TRI Environmental in accordance with ASTM C1746 for Sediment Retention devices to confirm the TSS removal efficiency. The testing involved running the sampling on two versions of the system with the flow rate of one being more than double the flow rate of the other. The testing included verification of the flow rate during the test. The test tank was set up to simulate a dry basin. The sediment-laden water was introduced within 2 feet (0.6 m) of the outer filter, which was done intentionally to remove any benefit of a typical forebay and travel distance that would be associated with a typical stormwater basin. The intent was to show the filter could meet water quality requirements without the other typical features of a pond so there was confidence that when placed in a pond, the performance would be equal or better than the lab testing results.


The results of the testing found that both versions of the skimmer with filter achieved greater than 90% TSS removal efficiency. The final version of the water quality filter has been installed in the test pond and continues to be monitored to confirm performance and verify lifespan of the filter materials (Figures 3 and 4).


Benefits of Pond Filtration

Based upon the field research and third-party laboratory confirmation, the skimmer with filter combination can be an excellent choice to aid in meeting post-construction water quality requirements in stormwater basins with several significant advantages over the traditional first-flush method. These include:

  1. The skimmer may be sized to be the quantity control orifice for smaller storm events such as the two-year 24-hour storm, which is often the lowest regulated peak flow event.
  2. The skimmer/filter combination will treat 100% of the runoff up to the peak storm managed by the skimmer flow. This results in the treatment of very small storm events as well as much larger storm events than what would generate the first-flush volume. Therefore, more of the annual rainfall is treated and treated to a higher level than the traditional first-flush method.
  3. The first-flush water quality volume can be released faster since it is not relying on settlement and is instead treated by the filter. Because the excess storage is not needed to slowly release the first-flush volume and the hydrology model can be accurately run to utilize the actual volume required to attenuate the regulated storm events, this results in a reduction of pond sizes by 15% or more.


Challenges with Filters in Ponds
As with any best management practice (BMP), there are some challenges to be aware of when considering using filters in basins.
Like all BMPs, maintenance of the filters needs to be considered. Based upon monitoring of prototypes, the filters would be expected to last at least two years, however, that would be impacted by the amount of sediment and debris in the basins. They may need to be cleaned by brushing away accumulated sediment and debris occasionally if they appear to become clogged. During prototype testing this was not necessary even though the pond used for the prototype testing receives a large amount of trash and debris in the stormwater runoff on a regular basis. As previously discussed, the skimmer should also be durable and expected to last for 20± years or planned to be replaced on a regular basis.


In areas that experience significant freezing, the filters may not be the best choice or at a minimum may need an alternative way to drain the pond, such as a perforated riser with a valve. Note that the filters have not been tested in areas other than very mild frozen conditions for short periods of time.


Possibly the biggest current challenge to the use of filtration in ponds is that there are very few areas with established standards to allow this type of design. Many areas do have standards for how to include manufactured treatment devices or proprietary devices as BMPs and these can often be applied to the use of filtration in basins.


There have been many advancements in practices and products to aid in achieving water quality requirements for stormwater in the past thirty years. It is important to remember that water quality has only been required in most of the country since 1990 for Phase I MS4s and 2003 for Phase II MS4s. As water quality becomes more of a focus and additional standards are recognized through ASTM and other national organizations, it should be expected that the industry will continue to evolve and provide more options to aid in keeping our most important resource clean. 


About the Expert
Jamie McCutchen, PE, is principal and founder of Rymar Waterworks Innovations, which makes the Marlee Float Skimmer and Rymar Water Quality Filter. He has over 30 years of civil engineering and land development experience and is licensed South Carolina, North Carolina and Georgia, USA.

Evaluating Restoration Success

Figure 1. Study co-author Dakota Hunter sampling environmental data along an invasion gradient of Japanese stiltgrass (Microstegium vimineum) at a wetland restoration site. (Photo credit: D. A. DeBerry)

Restoring the ecosystem services and functions of areas that hold or convey water is a widespread practice, often accompanied by evaluations of the success of that effort.


Invasive Species Density
One of the common issues in restored areas is the appearance of invasive plant species that may negatively affect the desired outcomes. In an effort to determine a level of invasive species presence that could be tolerated without impacting the overall restoration goals, a study evaluated 21 stream and 23 wetland restoration projects completed in Virginia, USA.1 The sites were evenly distributed across the Coastal Plain and Piedmont regions and ranged from one to 19 years since establishment. All sites fell under state and federal mitigation laws for non-tidal forested wetlands or stream restoration projects (Figure 1). The focus was on two invasive species common in constructed wetlands (Anthraxon hispidus and Typha spp.), two common in stream restoration sites (Lespedez cuneata and Lonicera japonica) and one common in both settings (Microstegium vimineum).


Transects were established from “completely invaded (>20%)” to “uninvaded” areas for each invasive species and plots were surveyed for plant species and cover. From these data, the amount of invasive plant cover that negatively impacted species richness could be estimated for each of the five target invasives. In the wetlands, all three invasive species negatively impacted community properties at the highest level of invasion, but the effects were less clear at lower levels. Often the highest richness occurred on the edge of the most invaded areas. A total of 194 plant species were identified in the wetland areas. The stream sites hosted 286 plant species with results similar to those of the wetlands study: species richness was negatively impacted in the highly invaded area but not in the moderately to uninvaded areas. Plots of invasive cover versus native richness suggested that the maximum values occurred at around 10% invasive cover. The authors suggest that efforts to remove invasive species at levels lower than 10% may be counterproductive given these results. However, they caution that continued monitoring is still important to know when these levels are being exceeded.


Effects of Flow Controls
The semiarid rangelands of the Gunnison Basin in Colorado, USA, were the focus of a study on the effects of erosion control structures on the surrounding vegetation.2 Land use over the years resulted in wagon tracks, stock ponds, roads and grazing that led to erosion in ephemeral and perennial stream channels.


To reduce this erosion, a variety of simple structures known as “Zeedyk structures” (See Resource) were installed to slow flow and to reconnect the channels with the surrounding floodplains. Aside from erosion control, these structures help to create wet meadows that host plants that are critical for wildlife, particularly the Gunnison sage-grouse, which is identified as a threatened species by the U.S. Fish and Wildlife Service. The 202,000-ha area has cold winters and warm summers with a highly variable average annual precipitation of 230 mm. Six of the study’s nine years were considered drought years.


The management objective for installing 900 structures in 11 drainageways was to increase obligate and facultative wetland species, including sedges, rushes and forbes, by 20% within five years. This was evaluated with plant surveys from 2012 to 2020 in 135 permanent transects in treated areas and thirty transects in untreated (no structures) areas of seven of these drainageways.


Overall, the 20% increase in wetland species was met in 75% of the ephemeral and 100% of the perennial stream areas, with a net cover gain of approximately 40% during the monitoring period. Areas with the least wetland plant cover tended to have the greatest increases. Among the 215 plant species present, 13 wetland species were relatively common, particularly Baltic rush (Juncus balticus) and western aster (Symphyotrichum ascendens). Forbs were increased modestly (4%/year) by the treatments, while grasses, mostly Kentucky bluegrass (Poa pratensis) and western wheatgrass (Pascopyrum smithii), increased only in the ephemeral stream areas. The authors conclude that these structures appear to be beneficial in creating wetland meadows, but that additional monitoring is needed to evaluate longer-term effects. 

References

  1. DeBerry DA and Hunter, DM. 2024. Impacts of invasive plants on native vegetation communities in wetland and stream mitigation. Biology 13:275. https://doi.org/
  2. 10.3390/biology13040275.
  3. Rondeau, RJ, Austin G, Miller, RS, Parker A,
  4. Breibart S,Conner, Neely E, Seward NW, Vasquez MG, Zeedyk WD. 2024. Restoration of wet meadows to enhance Gunnison sage-grouse habitat and drought resilience in arid rangelands. Restoration Ecology 32:2, e14039. doi: 10.1111/rec.14039.


Resource
Zeedyk structures: https://lowtechpbr.restoration.usu.edu/resources/recipes/Rock/erosionControl.html.


About the Expert
Rich McLaughlin, Ph.D., received a B.S. in natural resource management at Virginia Tech and studied soils and soil chemistry at Purdue University for his master’s degree and doctoral degree. He has retired after 30 years as a professor and extension specialist in the Crop and Soil Sciences Department at North Carolina State University, specializing in erosion, sediment and turbidity control. He remains involved with the department as professor emeritus.

Branding: Getting to the Heart of Sales

Most professionals in our industry think branding is more important for consumer — and retailed-based industries and less so for professional service-based companies. This is not true. Branding matters for lawyers and accountants and for professionals in our industry. When you sell your company, your brand can be as, if not more, valuable than other company assets. Branding is not just about logos and taglines — it’s about getting to the very heart of what your company stands for.


The steps to building an effective brand include:

  1. Understanding Your Brand. The foundation of effective branding is a clear understanding of your company’s values, purpose, culture and mission. Our industry is critical to environmental sustainability and public safety. It’s essential to communicate your expertise and innovative approaches to position your brand as an industry leader.
  2. Connecting with Your Audience. Successful branding connects emotionally with your audience. Highlighting successful projects that demonstrate that you understand the challenges of each of your audiences, showcasing your unique skill sets and sharing client testimonials can resonate with your audience.
  3. Maintaining Consistency. From your website, business cards, proposals and contracts, vehicles, uniforms and social media to your on-site signage and project reports, every touchpoint should reflect your brand’s voice and values. Consistent branding reinforces your message and helps clients recognize and remember your company.
  4. Telling Your Story. Sharing stories about the challenges your team has overcome, and their successes can humanize your brand and make it more relatable. Stories about how your team has prevented flooding, protected natural habitats, saved lives or supported community development can be particularly compelling.
  5. Engaging and Educating. Offering webinars, emails with embedded videos, blogs, vlogs, social media, white papers and case studies about best practices, trends and regulations positions your company as a thought leader. This builds credibility and provides value to your clients, encouraging them to turn to you as their go-to resource.
  6. Leveraging Technology. Artificial intelligence (AI) can play a significant role in enhancing your branding and sales strategies. AI-driven analytics can help identify trends and insights from large sets of data, predictive analytics can forecast future trends and AI-powered chatbots can improve customer service.
  7. Harnessing Social Media. Maintaining an active presence on social media platforms allows you to reach a broader audience and engage with clients directly. Sharing project updates, industry news and educational content can establish your company as an industry authority.

Ultimately, branding is about creating a lasting impression and fostering loyalty. By getting to the heart of what your company stands for and effectively communicating that to your audience, you can build a strong, recognizable brand that drives sales and growth.
Successful branding requires a deep understanding of your mission, values and purpose as well as a consistent and engaging presence to connect with your audience on an emotional level. By following these principles, you can ensure that your brand not only stands out but also resonates deeply with those you aim to serve. 

“…your brand can be as, if not more, valuable as other assets.”


About the Expert

Judith M. Guido is the chairwoman and founder of Guido & Associates, a business management consulting firm in the erosion control and green industry. Guido can be reached at 818.800.0135 or judy@guidoassoc.com.

Accurate Chemical Dosing for Safe and Effective Stormwater Management

Figure 1. List of common treatment chemicals for E&SC and stormwater treatment. Anionic is negatively charged and cationic is positively charged. Some chemicals listed are only used in active treatment systems due to high aquatic toxicity.

Chemical treatments, as authorized in the 2022 EPA Construction General Permit, have proven to be effective tools in both erosion and sediment control applications. Properly deployed, such treatments have consistently delivered positive results in removing sediment from stormwater runoff and also in making soils less vulnerable to erosion.


Despite many benefits, chemical treatment often carries a negative connotation based on the perception that adding chemicals to our environment is inherently “bad.” Nearly every substance on the planet is a chemical or chemical compound including the building blocks of our bodies, the air we breathe, the food we eat and the materials we use to help clean our water.


The fact that nearly everything is a chemical or chemical compound does not mean that all chemicals are safe. Chemicals are commonly described as toxic versus nontoxic. Despite this “nontoxic” perception, all chemicals eventually reach a toxic amount. Paracelsus, a Renaissance physician, famously stated that everything is a poison and it is the dose, or the concentration of the chemical, that makes it toxic. For this reason, it is important to understand how to safely use chemicals for stormwater management and erosion control.
Safety is often determined by comparing the safe and effective amount to the toxic amount. For example, safe chemicals we consume daily include water and caffeine. If we consume or are exposed to a large enough amount, both water and caffeine can reach a harmful, even lethal level. However, the likelihood of reaching a toxic amount is very low which is why we label them as safe. The greater the space between helpful and hurtful, the safer the chemical. We refer to the distance, specifically the ratio, between the effective amount and the toxic amount as the margin of safety (MOS).


Chemicals Treatments
There are multiple commonly used chemicals for erosion and sediment control and stormwater treatment (Figure 1). Chemical charge is a primary characteristic that governs use. Anionic, or negatively charged, chemicals are generally considered safe for aquatic organisms by federal regulations in the USA and in almost every state. They have a relatively low toxicity, minimal restrictions and are used for passive environmental applications. In contrast, cationic, or positively charged chemicals have a high toxicity, require additional permits and are typically limited to controlled, active treatment systems.1


Tools for Chemical Treatment
The goal of all chemical treatment should be to use the lowest effective amount while being environmentally protective. Using too much treatment chemical is not more effective and can actually result in decreased effectiveness in addition to safety. To achieve the goal of safe and effective use, the application rate (effective amount) must be lower than the toxic amount (below a maximum allowable use rate). The further the application rate is below the safe and allowable use amount, the safer the treatment.


Application Rates
Product application rates are set primarily by manufacturers and are determined following testing and use. An application rate is used to ensure the product is applied in an amount that achieves desired results, for example, soil stabilization or water clarification. Application rates for water are typically measured in weight or volume per volume of water treated — lbs./gal or mg/L. Land applications are typically measured in weight or volume per area — lbs./acre or kg/hectare.


Maximum Allowable Use Rates
Following application rates does not guarantee safe use. Maximum allowable use rates are safe limits for chemical treatment. The maximum allowable use rate is the highest concentration of a substance that can be discharged without causing toxicity to aquatic organisms.2 Some states provide lists of approved chemical treatments and calculated maximum allowable use rates.3,5,6 Maryland Department of Environmental Quality and Wisconsin Department of Environmental Quality both use secondary and acute and chronic values to calculate maximum allowable safe use levels. North Carolina Department of Water Quality uses the most sensitive chronic values based on aquatic toxicity testing.8 However, calculating these values can be complicated2,6,7 and is not practical for the average user, therefore using available lists is ideal. However, since only three states in the USA currently provide these lists, not all available products are represented. If a product is not represented, there are other avenues to estimate maximum allowable use rates:

  1. Inquire with your local or state regulator.
  2. Contact the product manufacturer.
  3. Use the “no effects value” if available. With a basic understanding of toxicity information, using a no observed effects concentration (NOEC) is a viable option for chemical treatment users to estimate a protective, maximum allowable use rate.7,8
Figure 2. Toxicity curve representing “endpoints” or concentrations of chemical that causes responses in a percentage of exposed organisms.

Toxicity Studies and the NOEC
A toxicity study is a controlled, conservative laboratory test where sensitive organisms in their most sensitive life stage are exposed to a range of chemical concentrations. These tests can be done in a short period of time (acute; days) or a longer period (chronic; week(s)). Chronic tests are typically more sensitive. Results of these toxicity studies are calculated toxicity endpoints, or concentrations that negatively affected a percentage of organisms (Figure 2). Common endpoints include the EC50 or LC50 (effective concentration or lethal concentration where 50% of the organisms die or experience negative effects). Other important endpoints include the NOEC or NOAEL (no observed adverse effects level), this is the highest concentration where no effects were measured. Although the EC/LC50 is one of the most referenced toxicity endpoints, it is not a safe value to use as a maximum allowable use rate. The LC50 represents the amount of chemical that results in death of 50% of organisms. The NOEC represents 0% mortality. It is typically acceptable to use the chronic NOEC as a maximum use limit.7,8 Maryland Department of Environment suggests using “significantly lower concentration than the NOEC,”7 presumably to provide additional margin of safety and layers of protection.


If the NOEC is available, it can be found in toxicity study results (Figure 3) and summarized in Section 12 of safety data sheets (SDS). Manufacturers should be able to provide these documents upon request. When using an SDS, toxicity reports should still be reviewed to vet data accuracy since toxicity reports are written by third parties and SDS are written by manufacturers. State calculated maximum allowed use rates should be used if available. However, if guidance is not available, the NOEC provides a relatively simple means to estimate a safe use limit. Always follow federal, state and local regulations when applying any chemical treatment.


Margin of Safety
As previously stated, the MOS is the calculated ratio between the application rate and the maximum allowable use rate. The margin of safety is calculated by dividing the maximum allowable use rate by the application rate. Each individual product should be evaluated separately as even products with the same active ingredient (i.e. anionic polyacrylamide, chitosan acetate, sodium montmorillonite, etc.) may have variable toxicities, maximum allowable use rates and suggested application rates. Chemicals with little or no MOS (~one or less) should be limited to active treatment systems. Anionic chemicals with higher MOS can typically be used in passive, semi-passive and active treatment. Although there is no set MOS value that defines a safe chemical, the larger the margin the better. A product with a MOS of five and application rate of 100 pounds (45.4 kg) could safely use up to 500 pounds (227 kg) and remain below the safe maximum allowable use rate. An important thing to ensure is that the same units are being compared between application rates and maximum allowable use rates. We often see application rates listed as lbs./gallon while toxicity values and maximum allowable use rates are listed in mg/L. If assistance is needed, manufacturers should be able to convert the values, or search engines like Google can perform conversions by typing convert mg/L to lbs./gallons in the search bar.

Figure 3. A summary of results from a chronic toxicity study conducted by Nautilus Environmental Washington Toxicity Laboratory on the Applied Polymer Systems 706b Floc Log with NOEC toxicity values highlighted (Nautilus 2010).


Example 1. Anionic polyacrylamide flocculant log (706b Floc Log)
Suggested Application Rate: 2 to 5 mg/L (16.6-41.5 lbs./1 million gallons water).
Maximum Allowable Use Rate: 42 mg/L (348.6 lbs./1 million gallons water).3
Margin of Safety (MOS): 42 mg/L ÷ 2 to 5 mg/L = 21 to 8.4.

Example 2. Bentonite based
granular (FLOC)
Suggested Application Rate: 180 mg/L (1,494 lbs./1 million gallons water).10
Maximum Allowable Use Rate: 650 mg/L (5,395 lbs./1 million gallons water).4
Margin of Safety (MOS): 650 mg/L ÷
180 mg/L = 3.6.

Example 3. 1% Chitosan acetate liquid (1% Liquifloc)*
Suggested Application Rate: 100 to 300 mg/L (834-2,503 lbs./1 million gallons water).10,11
Maximum Allowable Use Rate: 121 mg/L (1,010 lbs./1 million gallons water).9
Margin of Safety (MOS): 121 mg/L ÷ 30 to 300 mg/L = 1.2 to 0.4.
*Diluted products need extra care when reviewing and calculating to ensure that application rates and maximum allowable use rates are referring to the same solution and product. Diluted solutions will have different toxicity values and application rates than concentrated active ingredients (i.e. 100% chitosan acetate vs. 1, 2 or 3% liquid solutions).


Steps to Safe Dosing
By comparing the application rate, maximum allowable use rate and the margin of safety, we can make informed decisions on which chemicals to apply and in what amount. These three values provide a relatively simple method to wade through hundreds of available products with multiple active ingredients. When used correctly, chemicals can help solve many challenges faced in managing water quality and erosion and sediment control. The use of existing tools combined with the concepts presented in this article should serve to provide conservative guidance for safe and effective chemical treatment applications to control erosion and clarify turbid water while protecting valuable land and water resources. 

References

  1. EPA 2022. National Pollutant Discharge Elimination System (NPDES) Construction General Permit (CGP) for Stormwater Discharges from Construction Activities. United States Environmental Protection Agency. February 17, 2022.
  2. Wisconsin Department of Natural Resources. Additives. 2024. https://dnr.wisconsin.gov/topic/Wastewater/Additives.html.
  3. MDE 2024. MDE Flocculant: Chemical Additives Forms and Guidance, Approved List. Maryland Department of Environmental Protection 2024. https://mde.maryland.gov/programs/permits/WaterManagementPermits/Pages/MDFlocs.aspx.
  4. NC 2024. North Carolina DWR List of Approved PAMS/Flocculants. North Carolina Division of Water Resources. April 30, 2024. https://files.nc.gov/ncdeq/Water+Quality/Environmental+Sciences/ATU/PAM8_30_18.pdf.
  5. Wisconsin Department of Natural Resources. 2023. Previously Reviewed Additives List. https://dnr.wisconsin.gov/topic/Wastewater/Additives.html.
  6. EPA 1985. Guidelines for Deriving Numerical National Water Quality Criteria for the Protection Of Aquatic Organisms and Their Uses. Environmental Protection Agency. https://www.epa.gov/sites/default/files/2016-02/documents/guidelines-water-quality-
  7. criteria.pdf.
  8. MDE 2019. Procedures for Review of Chemical Additives for Sediment Control. Maryland Department of Environmental Protection. April 30, 2019.
  9. https://mde.maryland.gov/programs/permits/WaterManagementPermits/Documents/Chemical-
  10. Additives/Additive-Review-Procedure.pdf.
  11. NCDWR. June and July 2024. Email correspondence with Aquatic Toxicology Branch, Water Quality Division, North Carolina Department of Natural Resources. Topic: How use levels are calculated in published North Carolina DWR List of Approved PAMS/Flocculants. WADOE 2017. Use Designations for Erosion and Sediment Control for Chitosan-Enhanced Sand Filtration using 1% HaloKlear® LiquiFloc™ chitosan acetate solution. https://fortress.wa.gov/
  12. ecy/ezshare/wq/tape/use_designations/LIQUIfloc1PCTguld.pdf.
  13. Kazaz, Billur. 2022. Improvements in Construction Stormwater Treatment using Flocculants. Dissertation, Auburn University.
  14. Macpherson, John. Storm-Klear™ (Chitosan) Toxicity and Applications Construction Stormwater Treatment. October 2004.
  15. https://www.waterboards.ca.gov/water_
  16. issues/programs/stormwater/docs/advtreat/naturalsitesolutions.pdf.


About the Expert
Kyla Wood, Ph.D., is a biologist and aquatic toxicologist with a passion for clean water and applying science to find real world solutions. She is chief science officer for Applied Polymer Systems, Inc. and leads APS’s research and development, training and regulatory operations.

Mulch BMP Reduces Costs and Environmental Impact

Figure 1. Construction of mulch berm on Alabama Power rights of way.

Alabama Power Company in Birmingham, Alabama, USA, is taking the use of vegetative debris from land clearing — trees, bushes and other woody refuse — to new heights by using natural mulch berms instead of plastic silt fencing (Figure 1).

The company has a newly approved best management practice (BMP): Repurposing leftover mulch from land-clearing activities during construction to create natural berms on rights of way (ROW) to remove sediment from stormwater. This approach was used to help prevent sedimentation along a 5-mile path (8.05-km) of rights of way construction in Baldwin County, Alabama.


Alternative to Silt Fence
Buying and installing geotextile fabric silt fencing for large construction projects is a significant expense. Taking silt fences out of the construction equation and eliminating the need for regular maintenance and proper disposal, reduces waste, protects air and water quality and saves on costs.

Research conducted by Alabama Power in partnerships with Auburn University included tests to determine if berms created with natural, vegetative material gathered at construction sites could effectively reduce sediment loss.

In addition to evaluating the stormwater filtering benefits, the environmental benefits identified included the reduction or elimination of the need to move material to landfills, which reduces traffic and vehicle emissions while decreasing landfill waste.

The potential to save money and reduce environmental impact by using mulch on-site for erosion and sediment control was a viable option to study because one mile (1.61 km) of transmission line construction can produce about two million pounds (907 mt) of vegetative material.

From March 2023 through the first quarter 2024, Alabama Power enjoyed savings of approximately $78,000 USD per mile of construction by using natural mulch berms during the building of transmission line ROW at the industrial site in Baldwin County.

The company enjoyed a cost savings by using a natural mulch berm instead of silt fencing. The Environmental Affairs team estimated the cost of installing mulch berm at $3 USD per square foot, compared to $5 USD per square foot for silt fencing. While there is little to no maintenance costs for maintaining mulch berm, plastic fencing is fragile and easily damaged and requires maintenance at $15 USD per square foot.

Alabama Power estimates that use of silt fencing creates three pounds per square foot of waste compared to zero landfill waste from natural berms. An additional cost savings is the elimination of transportation site debris to a landfill.

The Auburn University research showed that natural berms, when installed correctly, were better at filtering stormwater and retaining sediment on-site than the silt fencing, so that any runoff was significantly cleaner compared to what passed through traditional fencing.
The Auburn University study found 98% sediment capture by the berms. There was an 83.9% average total suspended solids reduction downstream. Turbidity downstream was reduced by an average of 78.5%. Silt fences have an average discharge turbidity of approximately 1000 NTU; the slash mulch berms resulted in an effluent turbidity of 631 NTU.

Berms also produced less impact to the natural landscape, and fewer employees were needed on-site for installation, maintenance and removal of silt fence.

After research proved the concept, approval for broader use of berms was sought. Approval by the Alabama Department of Environmental Management was received in March 2023.

Figure 1. Construction of mulch berm on Alabama Power rights of way.


Site Work Proves Effectiveness
The need to clear the Baldwin County site was a perfect proving ground. It is not unusual to burn tree stumps and vegetation when land is cleared. If burning is not allowed, trucks must haul the vegetation to a landfill for disposal, which can be costly.
Natural mulch berms are a mix of trees and vegetation removed during “clearing and grubbing” operations. Bulldozers and other equipment was used to push up woody debris from the ROW, approximately 300 feet wide (91.4 m), 7,400 meters long (7.4 km). Afterward, the company built two transmission lines to serve the site.

Wood chipping and mulching was done on-site (Figure 2). With berms left in place, sediment will fill them in over time. The berms eventually break down and become part of the landscape.

Because trucks weren’t required to go to a landfill for mulch disposal, Alabama Power also reduced CO2 emissions. At a typical transmission construction site, as many as 100 truckloads of material may be removed daily and transported about 30 miles (48.3 km) to a landfill. Eliminating transportation of material translates to more than 291 metric tons of avoided CO2 emissions, not to mention emissions avoided because material was not burned.

An additional benefit is that mulch berms are more aesthetically pleasing during and after construction.
The ROW construction — time-consuming and expensive work — was Alabama Power’s first step in helping to develop a future plant site.
To prepare for the use of mulch berms, several employees within the company’s Environmental Affairs group performed behind-the-scenes research for nearly three years. The findings cleared the way for Alabama Power to implement this best management practice of substituting mulch berms for silt fencing during construction projects.


Looking to the Future
Alabama Power’s construction activities at the Baldwin County site are complete. The company expects to use mulch berms on multiple projects throughout the state and foresees many potential uses.


About the Expert
Donna Cope is a communications specialist at Alabama Power, where she has worked for 33 years.

MOST POPULAR