Home Blog Page 16

Incorporated Compost Effects on Infiltration, Water Quality and Vegetation Establishment

By Christina N. Kranz, Ph.D.; Joshua L. Heitman, Ph.D.; Richard A. McLaughlin, Ph.D.

Background

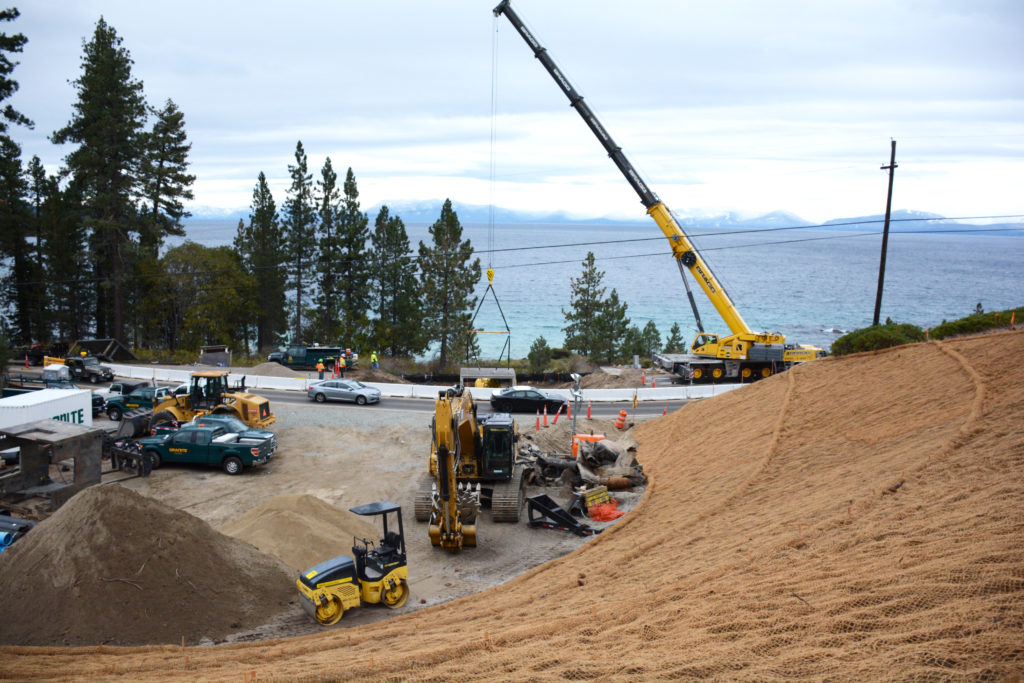
Soil disturbed by mass grading associated with roadway construction exhibits increased bulk density, reduced infiltration rates and reduced water storage capacity. The compacted soils have similar runoff coefficients to impervious surfaces, thereby yielding increased surface runoff. Mass grading generally results in subsoil exposed at the surface. Subsoils are low in nutrients and organic matter and generally limit substantial vegetation establishment, which leads to long-term erosion and sediment control problems. Many sources recommend tilling compost into the soil to improve soil conditions on disturbed, degraded soils. However, there has been little research aimed at determining the optimal compost application rates to concurrently improve stormwater infiltration or storage, increase vegetation establishment and limit offsite export of dissolved pollutants. Compost incorporation has the potential to achieve all of these goals.

Research Objective

• This field experiment was designed to determine compost incorporation rates optimized for:

• Increased infiltration or water storage.

• Effective vegetation establishment.

• Improved water quality from stormwater runoff.

Field Plot Setup and Methodology

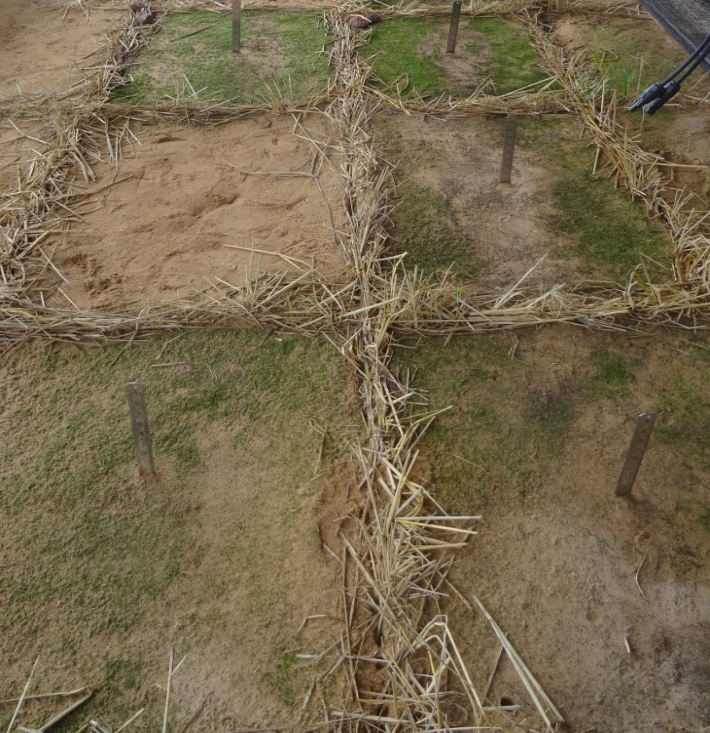
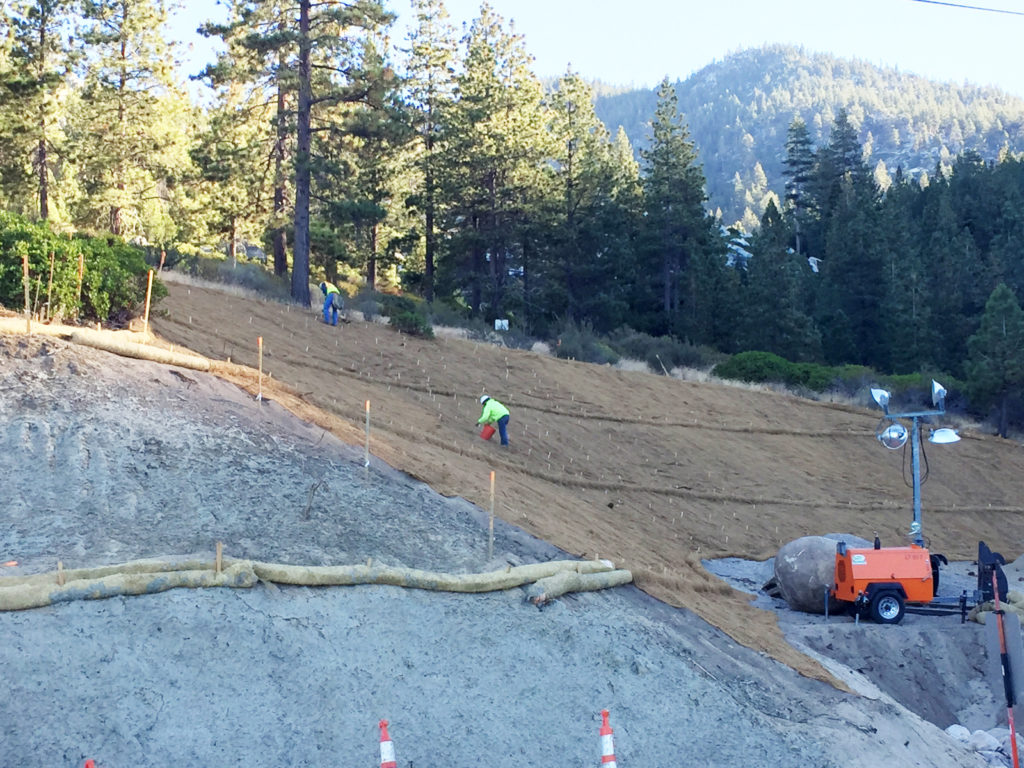
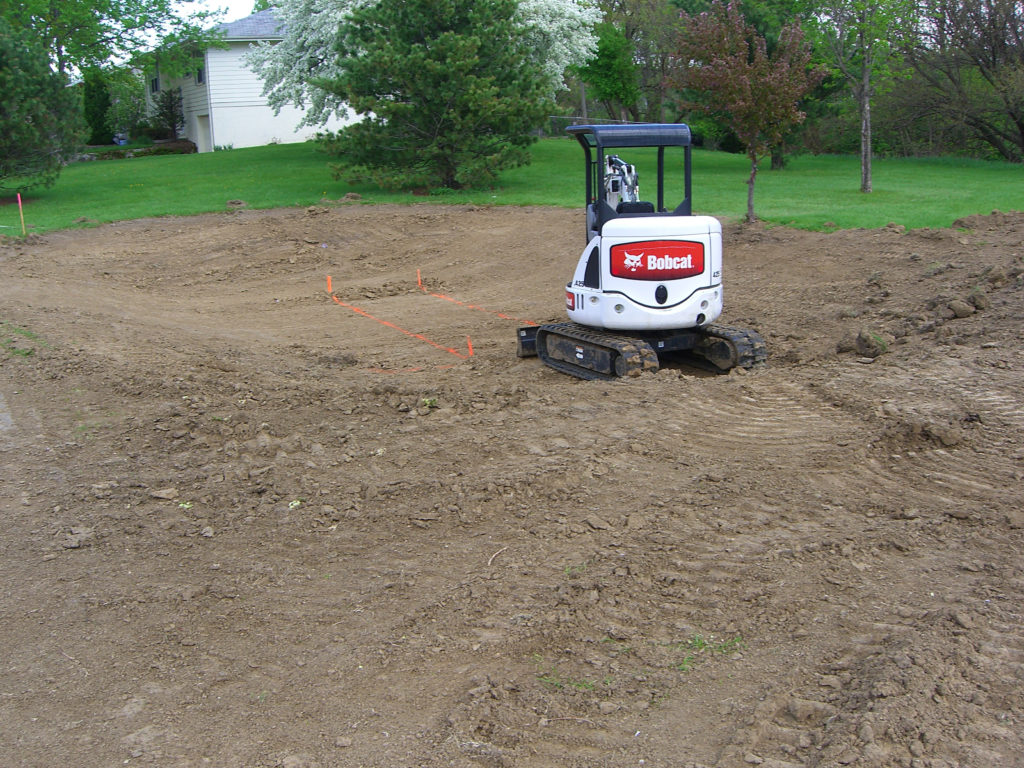
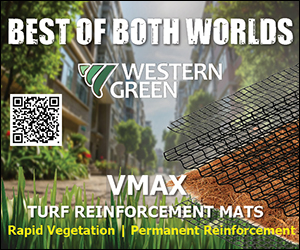
Field plots were established at the Sediment and Erosion Control Research and Education Facility in Raleigh, North Carolina. To simulate a construction site, topsoil and vegetation were removed to expose the subsoil, and the subsoil was graded to achieve a uniform surface with a 5% slope.

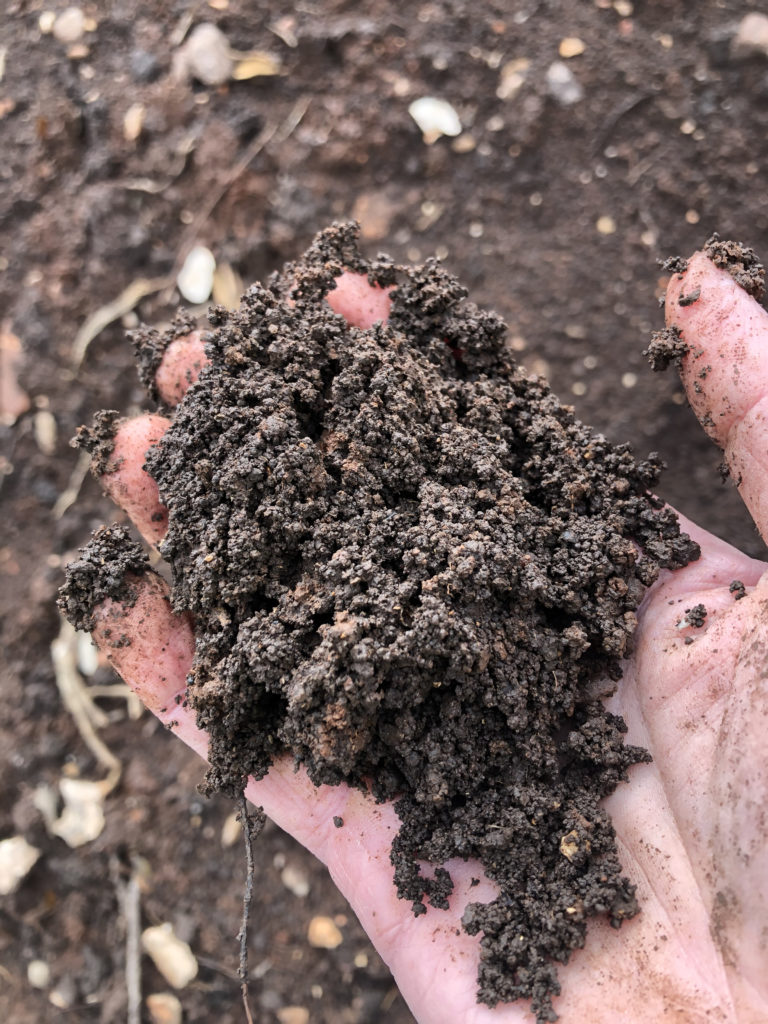
Two sources of yard waste compost were tested: a commercial product and campus compost (produced on North Carolina State University’s campus). The commercial compost was Seal of Testing Assured certified by the US Composting Council. All compost was incorporated to a depth of 15 cm (6 inches). The commercial compost was incorporated at 10%, 30% and 50% compost by volume. The campus compost was incorporated at 30% compost by volume. There was also a tilled-only control (no compost). All treatments received lime, fertilizer and seed according to North Carolina Department of Transportation guidelines.1

After each rain event, runoff volume was measured for each plot, and subsamples of the runoff were analyzed for water quality (turbidity, total suspend solids and dissolved pollutants). Vegetation biomass samples were taken four times over the course of a growing season. One year after plot establishment, soil bulk density and infiltration rate (single-ring infiltrometer) measurements were taken from treatment plots. Bulk density measurements also allowed us to calculate the moisture content of each treatment. One of the benefits of compost is it can increase the moisture holding capacity of soils.

Both the compost source and compost rate were evaluated using an analysis of variance for statistical difference between treatments. Comparisons were made between runoff volume, water quality, infiltration rate, bulk density, moisture content and vegetation biomass. This analysis identified how effectively a particular treatment performed over a wide range of treatment combinations.

Figure 1. (A) Plan view of treatment plots looking upslope. (B) Compost addition to the plots prior to tilling. (C) Top view of finished site preparation. (D) Top view of site configuration showing connection between plot areas and collection tanks.

Findings: Runoff

There were no differences for runoff volume collected between treatments for each individual rain event. In all cases, runoff volume was less than 10% of the total rainfall. The soil texture at this site was a sandy clay with 52% sand. Tilling alone was enough to loosen the soil in order to achieve high infiltration rates for this sandy soil. Two previous field studies at this location included a compacted control and a tilled control in addition to a compost-amended treatment (5 cm depth).2,3 In both studies, infiltration with compost incorporation was significantly increased compared to the compacted control but not compared to the tilled control. This was similar to the pattern we observed in our experiment, with no difference between tillage and tillage with compost—up to 50% compost by volume.

Findings: Water Quality

There were no differences in turbidity, total suspended solids or dissolved pollutants (NO3-, NH4+, PO43-, Cu, Pb, Zn) between treatments. The use of compost, up to 50% by volume, did not increase nor decrease the runoff water quality compared to a no compost control.

Findings: Vegetation Biomass

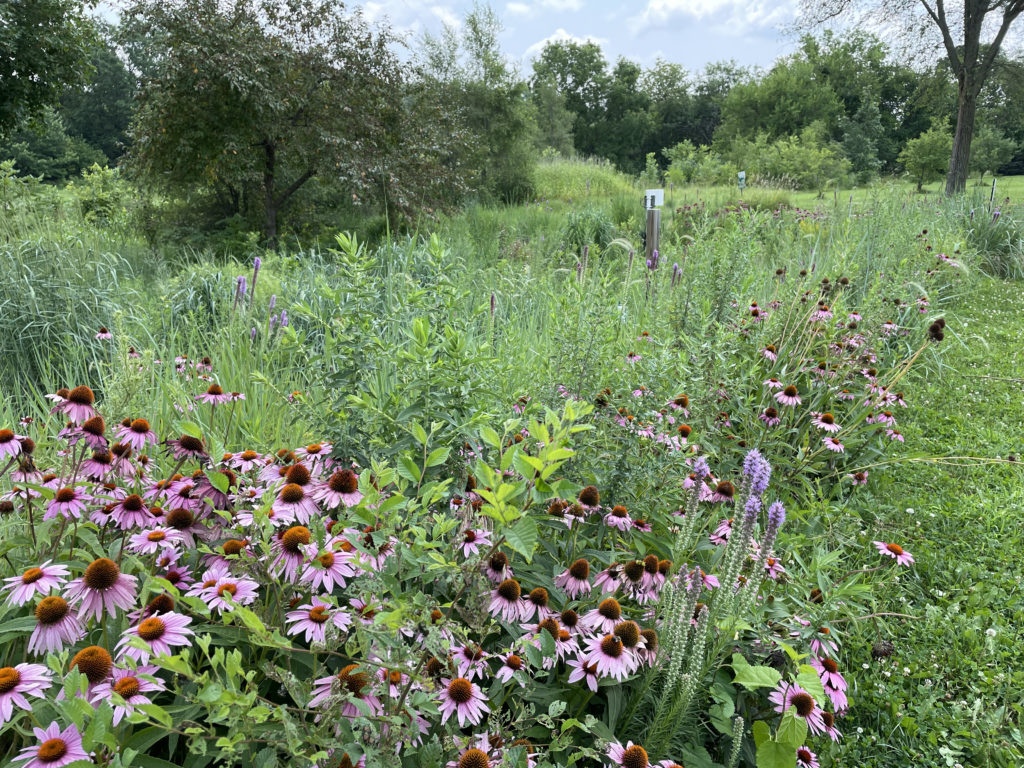
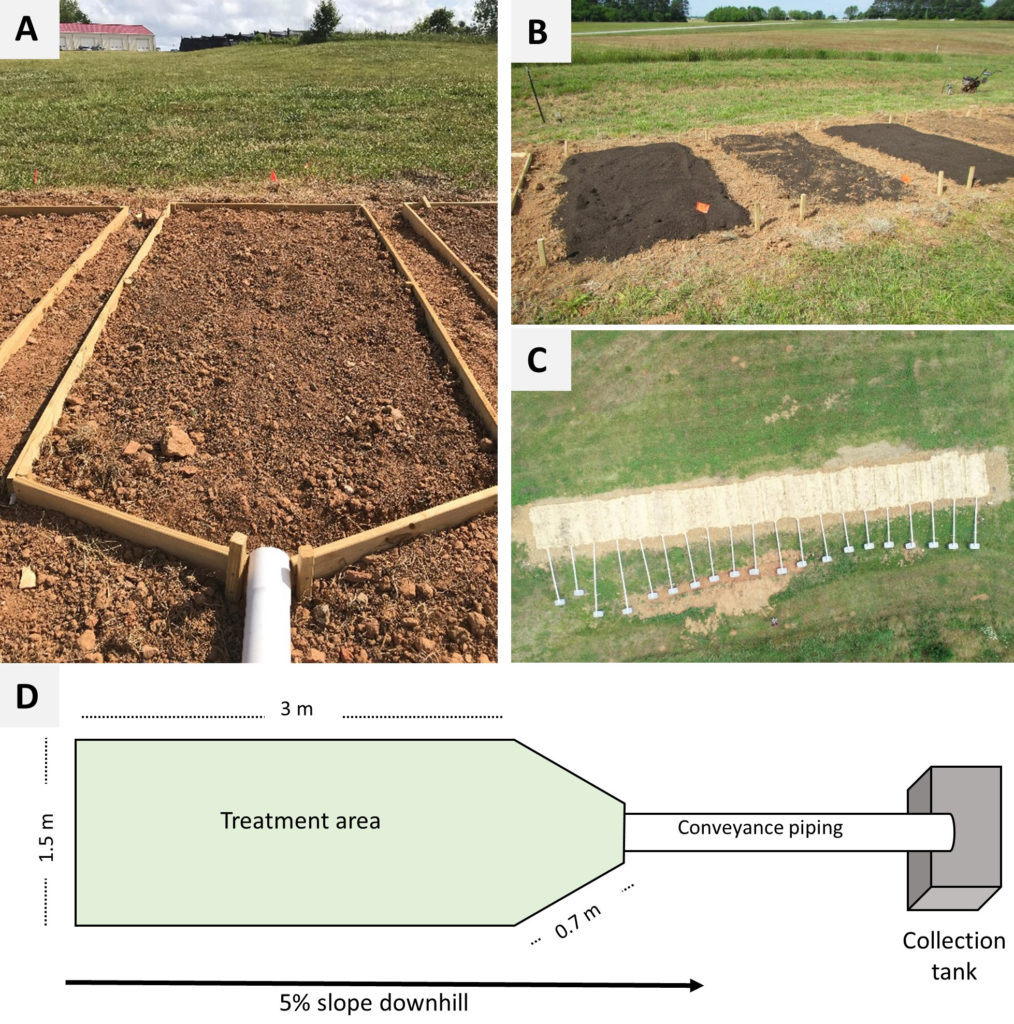
After one growing season, the total vegetation biomass from each treatment was calculated from four individual mowing events. The 50% commercial compost had the largest amount of vegetative biomass followed by the 30% commercial compost and the 10% commercial compost. The 30% campus compost and the no compost control produced the least amount of vegetative biomass and were statistically the same (i.e., there was no change in biomass production from the 30% campus compost compared to the control).

The commercial compost produced more vegetative biomass compared to the campus compost and the no compost control. Biomass tended to increase with increasing amounts of the commercial compost. A nutrient analysis conducted on the two sources of compost show the campus compost had higher levels of organic matter (80%) compared to the commercial compost (27%). The high levels of organic matter in the campus compost tell us the compost was not fully mature at the time of application. As a result, the campus compost likely reduced nutrient availability rather than increasing it.

Figure 2. Water quality sampling from runoff collection tanks.

Findings: Moisture Content, Bulk Density and Infiltration Rate

All compost-amended treatments had significantly increased moisture content compared to the no compost control. However, there were no differences in the moisture content between all compost-amended treatments. The 50% commercial compost had the lowest bulk density (0.9 g cm-3) followed by the 30% commercial compost (1.0 g cm-3), 30% campus compost (1.0 g cm-3), 10% commercial compost (1.2 g cm-3), and the no compost control (1.3 g cm-3). With each increase in compost application rate, there was a significant decrease in the bulk density, which in turn affected infiltration rates.

Compost incorporation significantly improved the infiltration rate to 36 to 68 cm hr-1 (14 to 27 in hr-1) compared to the no compost control at 27 cm hr-1 (11 in hr-1). As the compost application rate increased for the commercial compost, the resulting infiltration rate increased. The infiltration rate for the 50% commercial compost and the 30% campus compost were the fastest and statistically the same. The campus compost texture resembled more of a mulch like texture with larger pieces of woody debris, while the commercial compost was screened to a finer texture resembling peat. Bigger particles in soil could create larger channels for stormwater to infiltrate, which could be one of the reasons it took only 30% from the campus compost to have the same infiltration rate as 50% from the commercial compost. Note that all of the infiltration rates are at least 10 times that of typical soils, suggesting that areas with these treatments could absorb a great deal of rain and runoff from impervious areas.

While we found no differences between treatments for the runoff volume captured per rain event, we did find differences between treatments for infiltration rate (measured once one year after plot establishment). Average rainfall and storm intensity over the course of this experiment were 3.5 cm and 5.5 cm hr-1 (1.4 in and 2.2 in hr-1), respectively. The measured infiltration values are more than four times the amount of rain the field site received. The rainfall and storm intensities were too small to capture differences between treatments for runoff volume, but infiltration measurements suggest compost incorporation increases the ability of soil to absorb rainfall and possible runoff.

Figure 3. Vegetation establishment one month after plots were seeded.

Conclusions

Currently, there is a lack of research data available to support decisions on the optimal rate of compost incorporation for stormwater infiltration, water quality and vegetation establishment. Consulting companies and government agencies often recommend compost rates with little specific evidence to support them. This research effort sought to experimentally determine an optimal compost-amendment range for post-construction soils based on runoff volume reduction, infiltration rate, water quality parameters and vegetation establishment.

The experiment demonstrated that tilling may be sufficient to reduce runoff volumes, but that commercial compost did enhance vegetation biomass production. Soils are required to be vegetated prior to the end of construction, and compost incorporation prior to seeding has the potential to reduce the effects of compaction by decreasing the bulk density and increasing the infiltration rate, plus increasing vegetation establishment. Having good vegetation coverage is necessary for long-term erosion and sediment control. Our results suggest that a onetime incorporation of high quality compost at 10% or higher may improve soil for highway stormwater management but that increasing compost rates above 30% did not necessarily enhance benefits.

Compost should be STA certified or meet U.S. Composting Council guidelines for certification. This ensures that the compost meets certain characteristics, such as C/N ratio, which results in the most benefits from using compost. If a certified compost is not available, then a certified laboratory can test the compost that is available to you. For more information on STA compost requirements, finding a STA certified compost near you, or finding a certified laboratory to test compost, please visit the US Composting Council’s website at www.compostingcouncil.org. 

Acknowledgements

The North Carolina Department of Transportation sponsored the research presented in this article. The findings expressed in this article are those of the authors and do not necessarily reflect the view of the sponsors.

References

1) NCDOT, 2015. Erosion and sediment control guidelines. NCDOT, 453. Available from: https://connect.ncdot.gov/resources/hydro/HSPDocuments/NCDOT_ESC_Manual_2015_.pdf (accessed 06 July 2021).

2) Mohammadshirazi, F., Brown, V.K., Heitman, J.L., McLaughlin, R.A., 2016. Effects of tillage and compost amendment on infiltration in compacted soils. Journal of Soil Water Conservation 71 (6), 443–449.

3) Mohammadshirazi, F., McLaughlin, R.A., Heitman, J.L., Brown, V.K., 2017. A multi-year study of tillage and amendment effects on compacted soils. Journal of Environmental Management 203, 533–541.

About the Experts

Christina N. Kranz, Ph.D., is a postdoctoral scholar in the Crop and Soil Sciences Department at North Carolina State University. Her research focuses on using soil amendments to improve stormwater infiltration and reduce erosion.

Joshua L. Heitman, Ph.D., is a professor of soil physics and hydrology at North Carolina State University.
Richard A. McLaughlin, Ph.D., is a professor and an extension specialist in sediment and erosion control in the Crop and Soil Sciences Department at North Carolina State University.

Living Shorelines: Resilient Methods of Erosion Control

By Fara Ilami, MS, PMP

The need for connections between constructed and natural systems is becoming increasingly urgent. The majority of the global population is now urban and located near coastlines and waterways, and these dense concentrations exert a disproportionate influence on environments and ecosystem function.

Population density continues to grow in areas that contain fragile environments, and as a result, coastal ecosystems and their provisional services are in decline. In addition, sea level rise can cause “squeeze” of coastal habitats, which is defined as an intertidal habitat loss due to the high-water mark being fixed by a defense and the low water mark migrating landwards in response to sea level rise,1 and loss of property, while major storms can cause immediate destruction.

Homeowners may feel that the only solution to protect their property is to build traditional seawalls. This pressure to armor coastlines becomes more intense as neighbors armor their properties. A rise in coastal armoring has resulted in a direct loss in natural shoreline. In some coastal cities, such as Sydney, Australia, as much as 50% of the shoreline is armored.2 In the U.S., approximately 14% of the total shoreline has already been hardened—two-thirds of which is along the southern Atlantic and Gulf coasts.3 A particularly heavily armored area is in Palm Beach County, Florida, where 70% of the Lake Worth Lagoon shoreline is comprised of seawalls.4 Although not all coastal armoring is attributable to sea level rise—some is simply based on past engineering practices—the resulting natural habitat loss is the same.

An alternative to this armoring, called a living shoreline, is starting to gain traction among some property owners, especially those who are concerned about the resiliency of their erosion control methods.
According to the National Oceanic and Atmospheric Administration, a living shoreline is a shoreline management practice that provides erosion control benefits; protects, restores, or enhances natural shoreline habitat; and maintains coastal processes through the strategic placement of plants, stone, sand fill and other structural organic materials such as biologs or oyster reefs. In addition to these characteristics, living shorelines also provide benefits such as continuity of ecosystem processes, enhancement of wildlife habitat, nutrient and pollutant reduction, absorption of wave energy, storm resilience and adaptation to sea level rise.

Property owners will save money in the long run because these features require less maintenance and replacement than seawalls. In Florida, a hectare (2.5 acres) of salt marsh, which is only one type of living shoreline, is valued at $8,236 USD per year in hurricane damage reduction, and this value increases over time as components establish.5

Although a mature salt marsh can take 40-80 years to fully develop,6 storm protection benefits can be seen in as little as four to nine years post-installation.7 Recreational and aesthetic opportunities are also enhanced, as property owners can maintain or develop a kayak launch, fish from their shores and watch wildlife and enjoy the natural view of coastal areas.

There are several types of living shorelines and/or hybrid options including those with vegetation, oyster shell, native limestone riprap, terracing and retaining walls. The advantage of using a combination of solutions is that these can be tailored to withstand the energy level of the site. To determine which type of living shoreline is most appropriate in a given location, it is important to consider these factors:

• Maximize your route-density to avoid wasting gas. Source and severity of erosion.

• Maximize your route-density to avoid wasting gas. Sources of freshwater runoff.

• Maximize your route-density to avoid wasting gas. Existing shoreline structures and shoreline type.

• Maximize your route-density to avoid wasting gas. Existing bank height and slope.

• Maximize your route-density to avoid wasting gas. Sediment type.

• Maximize your route-density to avoid wasting gas. Wind exposure.

• Maximize your route-density to avoid wasting gas. Energy intensity.

• Maximize your route-density to avoid wasting gas. Tidal fluctuation.

• Maximize your route-density to avoid wasting gas. Proximity to boating navigational channel.

• Maximize your route-density to avoid wasting gas. Existing vegetation—upland, wetland
or aquatic.

• Maximize your route-density to avoid wasting gas. Presence of encrusting organisms.

Courtesy of NOAA Fisheries

There is no one solution type that is appropriate across the board. Some parts of the United States have a Living Shoreline Suitability Model available to assist in determining the best types of living shorelines to use at a site. Environmental consultants, erosion control professionals, marine contractors or local environmental agencies and non-profit organizations may be able to provide advice and expertise regarding selecting and installing a living shoreline at a particular location.

When installing a living shoreline with vegetation, it is important to put the right plant in the right place. Sun tolerance, drought tolerance, tidal tolerance, marsh zonation and availability and condition of suitable native plant types must all be considered. In addition, vegetation must be planted at the appropriate depth, spacing and time of year.

When installing a living shoreline with oyster shell or other types of breakwaters, one must consider the consolidation of the material, size, shape, orientation, grade, spacing and distance from the Mean High Water Line, and in some states, the Mean Higher High Water Line. Gaps between breakwaters are often recommended to allow for flushing and passage of wildlife. Other materials besides oyster shell should be used in areas where oysters do not have potential to recruit. Non-plastic alternatives for oyster shell aggregation should be used whenever possible.

Although much progress has been made in the development of effective shoreline protection that supports coastal habitats, more study is needed. The Florida Fish and Wildlife Conservation Commission is conducting one research project that compares the ecological benefits of four different shoreline stabilization methods that may be used in response to sea level rise: standard seawall, modified seawall resembling mangrove prop roots, mangrove living shoreline and oyster shell living shoreline. Results of this study, which is expected in 2025, along with others will provide more guidance in the future. 

Native plant living shoreline with oyster breakwater on the Intracoastal Waterway in Pensacola, Florida. Photo taken one year after installation. Oyster reefs alternatingly curved to allow for channel gaps that would limit wave energy from directly impacting the shoreline.

References

1) Pontee, N. 2013. Defining coastal squeeze: A discussion. Ocean and Coastal Management. Vol 84, pp 204-207. https://doi.org/10.1016/j.ocecoaman.2013.07.010.

2) Aguilera, Moisés A., Bernardo R. Broitman, and Martin Thiel. 2014. “Spatial Variability in Community Composition on a Granite Breakwater versus Natural Rocky Shores: Lack of Microhabitats Suppresses Intertidal Biodiversity.” Marine Pollution Bulletin 87 (1): 257–68. doi:10.1016/j.marpolbul.2014.07.046.

3) Gittman, Rachel K., Steven B. Scyphers, Carter S. Smith, Isabelle P. Neylan, and Johnathan H. Grabowski. 2016. “Ecological Consequences of Shoreline Hardening: A Meta-Analysis.” BioScience 66 (9): 763-773. doi:10.1093/biosci/biw091.

4) Palm Beach County. 2021. “Lake Worth Lagoon Management Plan.” https://discover.pbcgov.org/wrtf/PDF/Presentations/wrtf_lwl_mgmt_plan_29Apr2021.pdf#search=lwl%20management%20plan.

5) Costanza, R., O. Pe´rez-Maqueo, M.L. Martinez, P. Sutton, SJ Anderson, and K. Mulder. 2008. “The value of coastal wetlands for hurricane protection.” Ambio 37:241–248.

6) Boorman, L. 2003. Saltmarsh review: An overview of coastal saltmarshes, their dynamic and sensitivity characteristics for conservation and management. JNCC Report, No. 334.

7) Gittman, R., A.M. Popowich, J.F Bruno, and C.H. Peterson. 2014. Marshes with and without sills protect estuarine shorelines from erosion better than bulkheads during a Category 1 hurricane. Ocean and Coastal Management. 102:94-102.

About the Expert

Fara Ilami, MS, PMP, is the resiliency manager with the Northeast Florida Regional Council where she focuses on making the region more resilient to sea level rise, storms and other climate change threats in the environmental and economic sectors. Previously, she was with the Florida Fish and Wildlife Conservation Commission, where she served as the coastal planning coordinator and focused on coastal wildlife and habitat needs as well as coastal area socio-economic issues.

Money Matters

It Can Fuel Your Growth or Be Your Fatal Flaw

By Judith M. Guido

There is not a day that goes by that we don’t hear from news outlets or colleagues about supply chain challenges and inflation effects on people’s business and/or personal lives. Some people throw their hands up in frustration as if they have no control over their financial destiny.

The good news is that you have more control than you think you do. While there are limitations on what you can do with global supply chain issues at ports or the shortage of truck drivers or rising prices at the gas pumps and elsewhere, let us focus on the ways you can control cash flow and finances. This way you can make sure your money works for you and not against you.

Cash is the oxygen that keeps a business alive. How quickly—or slowly—it comes in and out of your organization determines the overall health and likely success of your company. Pre-bill, offer discounts for quick pays and automate pre-set timed invoicing wherever you can. These are simple and proven ways you can take your financial destiny into your own hands.

When prices increase, make certain you have done everything within your power to minimize price increases and the risks associated with those increases. Take a hard look at your money-making and management processes to ensure you’re as efficient as possible. This review should be done annually, at a minimum, or you are leaving money on the table. For example, if gas prices go up make sure you:

• Maximize your route-density to avoid wasting gas.

• Set up a business account with negotiated lower per gallon prices at a local gas station.

• Use credit cards or loyalty programs to obtain discounts.

• Take advantage of purchase-saving programs offered by your professional association memberships.

If you have leveraged everything you can, and the increased gas price is affecting your bottom line, do not be afraid to raise your prices. Send a notice to your customers explaining the reason, amount and timing of the increase. Make certain your communications are timely and transparent.

Follow this same plan for increases in items like insurances and equipment. You’ve got more negotiating power that you know. Less than 10% of companies meet annually with their business partners to negotiate better pricing, terms, delivery, loyalty rewards and co-marketing opportunities. Your partners want you to remain a customer, so they expect these negotiations.

Finally, take a hard look at your compensation model, as it is one of the largest expenses you have. Most people are terrified to change and discuss compensation with their team, but how and when you compensate are key strategic decisions that create a competitive advantage. You can energize your existing team and attract top talent while maximizing your bottom line. Take these fool-proof steps to lay the foundation and pathway for sustainable growth. 

Judith M. Guido is the chairwoman and founder of Guido & Associates, a business management consulting firm in the erosion control and green industry. Guido can be reached at 818.800.0135 or judy@guidoassoc.com.

Controlling Erosion in Challenging Situations

By Rich McLaughlin, Ph.D.

In some areas, preventing erosion is a relative “walk in the park” involving simple soil amendments, seeding and placing a temporary cover until the vegetation is established. For many other areas, this approach is not likely to succeed due to steep slopes, poor soil conditions and climate. A couple of recent studies explored options for these challenging environments and provided recommendations based on their findings.

Italian Mountainside

A study in the mountains of Italy explored the vegetation composition either one to nine or 16 to 31 years after vegetation establishment was attempted to slow erosion on landslides or quarry slopes.1 All of the slopes were “rehabilitated” using either a mixture of herbaceous plant seeds or that plus strips of woody plants, both with a temporary straw cover. The soils were greater than 50% gravel and even the fine portion was a loamy sand, so soil moisture holding capacity was quite low. The areas with herbaceous seeding had good cover soon after establishment, but the non-natives tended to disappear by years six to nine and the native species did not fill in at that point, dropping the cover from 95% to 50%. This was particularly evident where moisture was most scarce—in thinner soils and on southern exposures. Eventually planted natives and volunteer species did fill in to some extent. By the second period (16 to 31 years), the areas with only herbaceous planting had 70% cover, while those that included woody plants had over 95% cover and a 100% litter cover. The authors recommended that herbaceous species that do not thrive in such difficult conditions be avoided except in some situations where cover is needed quickly. They also suggested that woody native species should always be included to help reestablish ecological functions.

The moss biocrust treatment under the solar panel in the deflation zone. The partially buried straw shown was used in both biocrust treatments. Photo credit: Chongfeng Bu

Chinese Solar Installation

The combination of sandy soil, periods of low rainfall and wind provided a very challenging erosion control problem for solar panel installations in northwest China.2 In this study, many different treatments were tested in different zones under and around the solar panels. The panels tended to funnel the prevailing north winds under them, scouring soil and depositing it downwind. While the testing area receives an average of 430 mm of rain, it is very seasonal and sandstorms are frequent. There were four engineered methods: straw inserted into the soil in a checkerboard pattern, gravel or clay mulch or a combination of gravel and clay mulch. These were tested in the 6 m zone between the panels. In addition, two different plants (Sedum and Pennisetum sp.) were tested both under the panels and between them. Two different biocrust treatments (cyanobacteria and moss) were tested only under the panels, and this included the checkerboard-pattern straw to help get the biocrusts established. The plants were watered every other day for a month after planting, and the biocrust treatments were watered with a nutrient solution every other day for 75 days.

Erosion and deposition rates were measured in the deflation (under the panel), abrasion (lower edge) and deposition (downwind before next panel) zones for one year. All of the treatments reduced erosion to some degree relative to the control. For the engineered controls, placing gravel in the abrasion zone and clay in the deposition zone resulted in the greatest reduction in erosion at 87%. This was followed by gravel alone (78%), clay alone (74%) and straw (51%).

Underneath the panels, the vegetation reduced erosion by 20% to 36% and between the panels by 78% to 86%. The biocrust treatments were both effective at reducing erosion under the panels by 65% to 71% compared to the straw checkerboard alone. Overall, the authors recommended the moss-based biocrust under the panels and the gravel-clay combination between the panels. They also noted how much erosion was generated by the placement of solar panels in this fragile, desert area and that investigating methods to control erosion are clearly necessary. 

The combination treatment with gravel in the abrasion zone and clay in the deposition zone. Photo credit: Chongfeng Bu

References

1) Scotton, M., and D. Andreatta. 2020. Anti-erosion rehabilitation: Effects of revegetation method and site traits on introduced and native plant cover and richness. Science of the Total Environment 776 (2021) 145915. https://doi.org/10.1016/j.scitotenv.2021.145915.

2) Wang, C., R. L. Hill, C. Bu, B. Li, F. Yuan, Y. Yang, S. Yuan, Z. Zhang, Y. Cao, and K. Zhang. 2020. Evaluation of wind erosion control practices at a photovoltaic power station within a sandy area of northwest, China. Land Degrad Dev. 2021;32:1854–1872. https://doi.org/10.1002/ldr.3839.

About the Expert

Rich McLaughlin, Ph.D., received a B.S. in natural resource management at Virginia Tech and studied soils and soil chemistry at Purdue University for his master’s degree and doctoral degree. He is a professor and extension specialist in the Soil Science Department at North Carolina State University in Raleigh, North Carolina, specializing in erosion, sediment and turbidity control.

Close the Communications Loop for Successful Stormwater Management

By Tina K. Mudd, PMP, CPESC, REP, QSD/QSP

here are many articles about stormwater compliance that address how to plan for and install best management practices (BMPs) on construction sites, and how and when to notify regulators about changes to plans, but the most successful contractors take an extra step. They create an environment where everyone on the team—environmental engineers or consultants, contractor leadership and onsite crew—assumes responsibility for stormwater management.

Creating a communications loop that provides information to the people involved in oversight, regulation and installation of BMPs leads to a worksite that promotes proper stormwater management as an important part of the construction project. This results in a true team approach to stormwater management that leads to a more successful build that is not hampered by regulatory delays and ultimately this team approach will help the contractor’s bottom line.

The steps to building the ideal communications loop do not happen overnight and require some strategic decisions to change how the entire team views stormwater management.

Onsite maps encourage real-time updates that onsite project and team members can easily review.

Build a relationship with agency partners

Don’t wait for a site inspection to meet the regulatory representative. Meet the inspector before you begin building to talk about what BMPs you are implementing and why. Of course, the beauty of a stormwater plan is that you can constantly change it. By building rapport with your regulatory partner you can ensure open communication and a resource to trouble shoot solutions if the initial plan is not working.

In the first call or meeting with inspectors, ask how they want to receive communications: phone call, email or text. People like to communicate in different ways, so ensuring that you are using their preferred method lets them know that you respect their time and how they organize their work responsibilities.

This approach to communications makes the regulatory representative part of the team and eliminates an “us and them” atmosphere. Being open to alternative suggestions creates trust between contractors and inspectors and helps to form a good relationship. In the end, the goal is the same for both parties—to protect our communities’ water resources.

Most importantly, don’t be afraid to reach out to regulators proactively. Some contractors may be hesitant to contact inspectors if there is a problem to resolve because they think it automatically opens an enforcement action. This is not the case if the contractor has been transparent throughout the process. For example, if the dewatering process is not working as expected, communicate to the regulator why it isn’t working and ask if a different tactic can be tried. This type of communication shows that you are committed to proactive permit compliance on the site and are working to find the most effective solution.

Not all construction companies have environmental engineers on staff, so they may rely on consultants to help design and oversee the performance of BMPs as well as work with regulators. No matter how experienced the consultant is, contractor representatives also need to develop relationships with agency representatives. The contractor is ultimately responsible for stormwater management, so there is a risk if a third party is allowed to handle the relationship with no involvement from the contractor.

Educating employees on purpose and value of BMPs leads to a “team” approach for stormwater management.

Communicate with and listen to the construction crew

The more a construction crew knows about stormwater management and why certain measures are taken to control stormwater, erosion, and sediment, the more invested in the process they become. In addition to explaining why specific BMPs are installed at a jobsite and how they work to manage stormwater better, keep the issue top of mind by continually offering information. Include environmental topics along with safety topics in the weekly tailgate talks. All construction crews understand the importance of safety on a jobsite, so the inclusion of environmental topics in these meetings conveys their importance.

Other ways to keep onsite construction crews aware of stormwater management importance include:

  • Post a stormwater control map onsite. Place a map where it can be seen during every daily status meeting and encourage forepersons and project managers to use a pen to markup changes and updates. This keeps the plans and the actual onsite BMPs synced so that everyone has the same information.
  • Empower employees. All employees should stop work when they see an erosion or water control issue, just as they are empowered to stop work when they notice a safety issue. For example, any employee driving by a silt fence that has fallen should know to report the issue so it can be addressed immediately. The only way this happens is by educating all employees about the importance of that control.
  • Educate forepersons, supervisors and project managers. Send forepersons and project managers to courses where they learn about stormwater management, permit requirements and types of controls. They do not have to become experts, but they will benefit from a basic education and the language with which to speak with inspectors. If the inspector shows up unexpectedly, the supervisor or foreperson is not afraid to handle a compliance inspection—in fact, they are proud to do so.
  • Listen to the onsite crew. In addition to educating onsite employees through tailgate talks, seminars or online courses, remember that good communication is a two-way street. Ask employees who are installing or working around the BMPs if they have alternate installation ideas. Asking for their input demonstrates the “team” concept of stormwater management.
Onsite employees can offer insight into how to work with and around BMPs.

Lastly, don’t make the most common mistake of assuming the installation, oversight and maintenance of BMPs is someone else’s responsibility. The foreperson and crew are responsible for installing BMPs and numerous other things to build the project. Maintain a realistic perspective while communicating stormwater priorities. Remember that the goal is that everyone—contractor, inspector and onsite crew—works together as a team. 

About the Expert

Tina K. Mudd, PMP, CPESC, REP, QSD/QSP, is the environmental manager at Granite Construction in Sparks, Nevada. She holds a Bachelor of Science and a Master of Environmental Policy from the University of Nevada, Reno. She is responsible for regional environmental permitting, monitoring and compliance for all aspects of the construction and materials operations. She is a member of the Associated General Contractors (AGC) National Environmental Steering Committee and Chair of the Nevada AGC Environmental Committee.

Sampling is your Best Friend and Best Spend

By Thomas Schneider, CPESC

Too often, an MS4 operator focuses on checking off permit requirements on a list rather than thinking about the intent of the MS4 program.

The intent of the MS4 program is to minimize the discharge of pollutants into waters of The United States. Although a specific state may not require the MS4 to sample, it is a best practice with many benefits. Without sampling there is no way to know if the stormwater discharges from the MS4 are in line with state and national water quality standards or if there is a problem and where the problem might be.

Truth be known, sampling is the MS4 permit holder’s best friend. Sampling can prevent the system from wasting a lot of money on public education by helping the system target messages to the right audience and the right issue. Some systems send literature or pamphlets in their water bills to all customers. The pamphlets might address over-fertilization issues, which is a good topic to cover, but is it a spend that is well targeted? First, this approach assumes there is an over fertilization problem to begin with. Second, it assumes that it is happening across the entire MS4. Third, it assumes that the entity that receives the water bill is the same entity that is over fertilizing.

If however, the MS4 samples first, the permit holder will know if there is a problem and, if there is, where it is located. There is not a one-size-fits-all solution to fertilizer in the stormwater runoff. If the water sample reports indicate the problem is in a drainage shed made up of businesses, just notifying the business owners how to apply fertilizer correctly will not get the information to the person causing the problem. The problem would most likely be the landscape maintenance companies that are hired to tend to the landscaping.

If the problem is in an industrial area of the MS4, mismanaged storage or handling of fertilizer is more likely to be the problem rather than landscaping. In this case, the pamphlet in the water bill might get to the right person, but it will address the wrong problem.

Even in a residential area, the pamphlet may reach the wrong person. If it is an area where the majority of the homeowners tend to their own lawns, the information is helpful. In areas where most of the lawns are cared for by a third-party service company, the pamphlets miss the mark.

The last example is over-fertilization in a large park. The city employees that are over fertilizing the park might receive a pamphlet at their home if they live in the city, but is it the best way to educate them about their job?

In each of these examples, the MS4 operator can check the box for public outreach and education, but did the cost of outreach have any or much impact on water quality? The answer is that you will not know unless you sample. Most likely, money was wasted with this shotgun approach to education and outreach.

So how do you move away from the shotgun approach? It begins with understanding who you will be educating, what control the MS4 has over the individual and the cost associated with education of the individual. The next installment of this series will address the three groups that should be targeted for education—citizens, MS4 employees and the regulated community—and how best to reach them. 

About the Expert

Thomas Schneider CPESC, is vice president at Stormcon, LLC. He has 28 years of experience and extensive training in storm water regulations focusing on construction site erosion and sediment control. He works directly with local, state and federal agencies as well as working one on one with clients to develop and implement storm water programs that will fit their needs.
Editor’s Note: This is the first in a series of three articles that discuss practical issues and solutions related to the Municipal Separate Storm Sewer System (MS4) permitting program. While MS4 is a United States-based program designed to control water pollution, strategies used to meet permit requirements can be applied to storm sewer system operators in any location to support clean water efforts.

Green Infrastructure Bioretention

By Bill Murphy, PE

The city of Des Moines, Iowa, U.S. is investing in its infrastructure to eliminate combined sewer overflows (CSOs). Like many cities, Des Moines has neighborhoods with no existing storm sewer or undersized storm sewer systems that need to be replaced or reconfigured. Removing several blocks of paved streets and relocating an unimaginable number of utility conflicts to install an entirely new storm sewer system
is impractical.

One such example is the Near West Side Sanitary Sewer (NWSSS) project located near Drake University. The city’s consultant engineer for this project, Wes Farrand, PE, Snyder & Associates, incorporated green infrastructure (GI) to intercept stormwater runoff and take multiple gulps of stormwater along the curb to capture, treat and slowly release a reduced flow downstream. A residential neighborhood along the 2800 block of Rutland Avenue in the upper corner of the project’s watershed was selected. This mature neighborhood has no storm sewer inlets along the street. Minor street flooding was common.

Aerial photo of bioretention underdrain being installed between street and sidewalk. This is one of six bioretention cells along the 2800 block of Rutland Avenue in Des Moines, IA. Aerial photo provided by Synergy Contracting.

The project engineer started by creating depressions between the back of curb and the existing city sidewalk to create shallow basins for ponding stormwater as it slowly drained down through a bioretention system. After first maximizing the areas bounded by street, sidewalks and neighborhood driveways, Farrand reduced the footprint of those proposed areas to account for mature trees, utility poles and any existing underground utility conflicts. What remained were six individual areas where a bioretention system could be installed.

Farrand started his design with the end in mind. Since bioretention systems are typically designed to handle the first flush or a similar design storm event, he accounted for system overflow during major storm events. He designed a beehive inlet structure at each of the six cells. Those structures connected to a collector storm sewer pipe under the street. The underdrain of each bioretention system connected to a corresponding newly installed overflow structure. Since the bioretention cells were built after street construction was completed, it was critical to not damage the newly paved street or residential driveways during construction of the bioretention systems.

Maintenance cleaning begins with shoveling debris and sediment out of the concrete flume and from the top of the curbside pretreatment device. Then the grate can be removed to allow access to scoop sediment out of the unit.

Each of these systems receives the first flush from its corresponding drainage area. Any major storm event that fills the bioretention cells and overtops into the overflow structures will continue to drain down the street as it always has, but with much less flooding since each of these cells will be taking a “gulp” and reducing the peak flow. Exact numbers for the design flow calculations is not readily available since we maximized the size of each cell during construction.

Due to late fall construction, proposed plants were planted in the spring. Plants are vital to these systems for long term success, greater pollutant removal and pleasing aesthetics. Plants remove phosphorous and nitrogen from stormwater and their roots provide pathways for water to pass through the media and into the underdrain. Locally available plants that are hardy in regard
to periods of drought and short term inundation with standing water will thrive
in bioretention.

Maintenance was a top concern of the city so Farrand proposed curbside pretreatment devices to capture large debris and most sediment before releasing the runoff into the bioretention cell. Construction of these GI improvements was completed fall 2020. A site visit in March 2021 showed that the pretreatment devices on all six cells worked as designed and captured debris and sediment that would have otherwise settled onto the bioretention systems.

The tools used to clean the debris and sediment from the curbside pretreatment device and the bioretention cell were a shovel, a rake, a pitchfork and buckets. Maintenance was simply a matter of removing the material from the street gutter, through the concrete flume and from above the grate of the pretreatment device. The grate is manufactured as two halves so one person can easily lift and remove the grate. After removing the grate, the sediment is scooped out of the unit and the filter screen is removed for cleaning. Once all cleaning is done, the filter screen and grate are reinstalled.

The pretreatment device at the first bioretention cell on Rutland Avenue yielded 29 lbs (13 kg) of debris and sediment after only five minutes of maintenance cleaning. Following the demonstration of how to properly clean a bioretention cell, the other cells were cleaned by the general contractor or landscape contractor under the city’s direction. No measurements of sediment were taken at the other five.
Every city will need to determine how to best manage green infrastructure after installation. Like any filter, bioretention systems and pretreatment devices must be inspected and cleaned as part of routine maintenance.

Once the curbside pretreatment device is cleaned, the bioretention cell must be cleaned. Thanks to the pretreatment device, there is no sediment in the cell. Most of the debris in this cell is leaf litter due to the mature trees in this residential neighborhood. Similar bioretention systems in retail or industrial areas typically collect a large percentage of trash rather than vegetation. Since this is a new project, this cell had not yet received its proposed plantings at the first site visit, which made cleaning easy and relatively quick. After 20 minutes of removing debris—mostly by hand—87 lbs (39 kg) of material was collected. That brought the total amount of sediment and debris collected from this first system to 116 lbs (53 kg). With a drainage area of 115,000 ft2 (10,684 m2) for this one cell, that is a lot of pollution captured locally and not allowed to flow downstream through the city of Des Moines and eventually into the Des Moines River.

Filters collect debris and sediment after plantings installed to make cleaning and maintenance of the bioretention cell easier.

Plantings were added in the spring to create the “bio” component of the cell. A site visit several months later showed that sediment and debris inside the pretreatment units proved that the “filter” was working as intended and kept the debris out of the bioretention cells. It will be much easier to remove the sediment and debris from the pretreatment units than it would be to carefully try to remove it from the bioretention cells without damaging the plants.

There will still be some maintenance required in each bioretention cell but it will be much simpler and quicker than it would have been without the pretreatment units. Any filter that is actually working should be dirty and need to be cleaned or replaced. The same concept applies to your furnace filter at home and the air filter in your car.

Since this Rutland Avenue project is part of a very large public improvement project there is a long transition period after the GI construction is complete but before the entire project is finished. During that time the city, contractor and neighbors are not sure who is responsible for maintenance. That is part of the education that is necessary following installation of bioretention cells that engineers must communicate to cities.

This one city block of GI makes a significant difference in reducing localized flooding in this residential neighborhood. However, the bioretention systems only make a minor difference in the flooding and water quality in the NWSSS watershed because it is only one block of GI, but it is one small step in the right direction. In order to make a significant impact on a watershed scale these types of practices, along with permeable paving, soil cells for trees, inline stormwater filters, underground detention and more would have to be installed and maintained throughout the watershed. The natural progression is to implement GI strategies throughout the entire city. That will require long term strategies from all stakeholders.
Think of it like the starfish story that makes the rounds on social media. A guy walking along the beach is picking up dying starfish and tossing them back into the ocean to save their lives. Another man walking towards him says “There are countless dying starfish. Do you actually think you are making a difference?” The first guy picked up another starfish, tossed it into the water and said with a smile, “It made a difference for that one.” 

About the Expert

Bill Murphy, PE, civil engineer, Quick Supply Co., ASP Enterprises, Bowman Construction Supply, Cascade Geosynthetics. He spent the first 15 years of his career as civil engineering consultant before becoming a stormwater expert in the construction supply industry more than 10 years ago.

The Preserve at Oak Meadows

Re-routing a Segment of Salt Creek for Stream Restoration

By Erin Pande, PWS, CFM; Drew Kustusch, PE, CFM

The successful design and construction of the bypass channel for the Preserve at Oak Meadows project facilitated 700,000 cu yd (535,188 cu m) of earthwork and restoration of Salt Creek.

The Preserve at Oak Meadows located in the Villages of Addison and Wood Dale, Illinois, is owned and operated by the Forest Preserve District of DuPage County. It contained the 18-hole Oak Meadows Golf Course and the Maple Meadows East-9, which together consisted of 27 holes of golf on a continuous 288-acre (1.17-km2) property, previously referred to as the Oak Meadows Golf Preserve. It is a picturesque course with Oak/Hickory woodlands and open savannas with Salt Creek meandering through it. In February 2009, the 86-year-old 45,000-sq ft (4,180-sq m) clubhouse at the course was lost to fire damage. This loss, combined with the increase in the frequency of significant flood damage, brought the Oak Meadows Golf Preserve to a critical juncture.

Figure 1: Removal of two low-head dams on the property was a key goal of the project.

Recurring flood damage to playing areas as well as aging features on a course were eroding the customer base and lowering the operational revenue. In 2012, Engineering Resource Associates, Inc. (ERA) and Martin Design Partnership, Ltd. developed a master plan for the redevelopment of Oak Meadows Golf Preserve that included:

  • Reconfiguration of the 18-hole Oak Meadows golf course and the 9-hole Maple Meadows golf course to one, 18-hole course.
  • Regraded greens with improved flood protection to decrease loss of playability from flooding.
    Elevation, removal and relocation of golf cart bridges.
  • In-stream modifications to improve water quality through riffles, a-jacks and sheet pile wall removal, and rock/log toe and fabric encapsulating soil lifts.
  • Wetland creation, wetland restoration and riparian/prairie/savanna restoration; and expanded floodplain storage.

While the project as a whole was immense at 700,000 cu yd (535,188 cu m) of earthwork and the sediment and erosion control methods that were used throughout the site were extensive, this article will focus on the stream bypass methods used to construct the in-stream aspects of the project only.

Figure 2: Profile and cross-section for the bypass channel.

Within the project limits, there were two low-head dams that spanned Salt Creek (Figure 1). In addition to negatively impacting water quality, the dams were a physical obstacle for migrating aquatic life and dangerous for paddlers. A-jacks and sheet pile walls also contributed to poor water quality and lack of habitat. The plan proposed removal of both dams and existing bank stabilization measures. Following removal, stream channel and bank stabilization was necessary. This included the addition of pool and riffle sequences, improved substrate, in-stream habitat structure and streambank stabilization.

A temporary bypass channel for Salt Creek was used to facilitate efficient construction. The bypass channel was sized to convey the one-year, 24-hour storm event and all smaller storm events. This design storm was not a regulatory requirement, but rather was selected as a balance between the cost of additional channel excavation and the cost of construction site and scheduling impacts due to overtopping. A cofferdam was placed in Salt Creek channel at the upstream and downstream tie-in locations for the bypass channel. The crests of the cofferdams were designed at the one-year storm elevations. For this design, the one-year flow was determined using an extrapolation from Salt Creek Full Equation model flow data and was determined to be 770 cu ft/second (21.8 cu m/second).

The proposed bypass channel was trapezoidal with a 15 ft (4.572 m) wide bottom and 2:1 side slopes and 0.75 mi (1.2 km) long. The earthwork quantity associated with the bypass channel was approximately 19,255 cu yd (14,722 cu m). The channel was lined with a non-woven polyethylene geotextile fabric with a Manning’s n value of approximately 0.025 in order to increase the conveyance capacity as compared to a bare-earth or rock-lined channel. The fabric was secured by burying the upstream end of each segment of fabric and overlapping the downstream end over the subsequent segment. The bypass channel design was also input into the modified existing river model in the USACOE’s Hydrologic Engineering Center River Analysis System (HEC-RAS).

Due to the requirements of the stormwater certification issued by DuPage County, no increase greater than 0.1 ft (0.03 m) as compared to the regulatory FEMA Flood Insurance Study elevations along the river corridor was allowed during or after construction. The results with the included bypass channel for the 10-year and 100-year flows showed maximum increases in elevation of 0.03 ft (0.009 m) and 0.02 ft (0.006 m), respectively, which was considered negligible, and maximum decreases in elevation of 1.03 ft (0.31 m) and 0.62 ft (0.19 m), respectively. One-year flows were also modeled in the bypass channel to verify that the channel had sufficient capacity. The cross-sections from the HEC-RAS output showed that the one-year flows would be contained within the proposed bypass channel. Plan and profile and cross-section sheets for the proposed bypass channel were prepared and were included in the final engineering plan set (Figure 2).

Permits were required from the U.S. Army Corps of Engineers, Illinois Department of Natural Resources Office of Water Resources, DuPage County Stormwater Management, Kane-DuPage Soil and Water Conservation District and Villages of Addison and Wood Dale. Pre-application meetings were held with all agencies concurrently to determine the best means and methods for constructing the in-stream restoration.

igure 3: Bypass channel during construction.

The construction sequence for installation of the temporary bypass channel and dewatering of Salt Creek is below:

  • Excavate bypass channel but leave earthen berms at both upstream and downstream ends.
  • Stabilize bypass channel with geotextile liner custom fabricated and field welded.
  • Install concrete blocks in the energy dissipation zone at the downstream bypass channel discharge in order to reduce velocities and distribute flows prior to the water entering the downstream channel.
  • Install concrete blocks in the energy dissipation zone at the upstream bypass channel location to reduce velocities where the natural channel meets the fabric-lined channel and minimize erosion potential.
  • Place bypass channel cofferdam immediately downstream of downstream earthen plug and immediately upstream of upstream earthen plug.
  • Excavate downstream existing earthen plug to tie bypass channel into the river and finish stabilizing downstream bypass channel with liner.
  • Excavate upstream earthen plug to tie bypass channel into the river and finish stabilizing upstream bypass channel
    with liner.
  • Remove downstream bypass channel cofferdam.
  • Remove upstream bypass channel cofferdam.
  • Install in-stream sheet pile cofferdam just downstream of upstream bypass channel tie-in.
  • Install backflow sheet pile just upstream of bypass channel downstream tie-in.
  • Install in-stream sump pit and dewater isolated work zone within existing
    river channel.
  • Install energy dissipation measures in the coffered portion of the existing river channel just downstream of the upstream sheet pile.

The temporary bypass channel functioned generally according to plan during construction (Figure 3). However, modifications were needed as the geotextile fabric began to float due to unanticipated groundwater uplift pressure beneath the channel. Angular and subangular boulders ranging in diameter from 18 in to 36 in were placed on the geotextile at high stress locations to provide additional weight over the fabric and prevent it from continuing to float and tear (Figure 4).

The temporary bypass channel allowed for the removal of the low-head dams, sheet pile walls and a-jacks; construction of the pool and riffle sequences, improved substrate, in-stream habitat structure and streambank stabilization.

Upon completion of the in-stream work and installation of permanent erosion control measures the stream was returned back to Salt Creek. The following is the sequence used for diverting the flow back into Salt Creek.

  • Remove in-stream dewatering sump pit.
  • Remove downstream sheet pile from
    Salt Creek.
  • Remove upstream sheet pile from Salt Creek.
  • Install sheet pile cofferdam at upstream bypass channel to divert flow back into
    the river.
  • Dewater and install embankment plug at the upstream end of the bypass channel.
  • Install sheet pile cofferdam at downstream bypass channel.
  • Dewater and install embankment plug at the downstream end of the bypass channel.
  • Remove sheet pile cofferdam at upstream and downstream bypass channel tie-ins.
  • Perform final stabilization of in-stream banks at upstream and downstream bypass channel tie-ins.
  • Remove energy dissipation measures at upstream and downstream bypass channel tie-ins.
  • Remove bypass channel geotextile liner.
  • Final grade temporary bypass channel according to plans.
  • Install temporary cover crop, permanent seed, temporary erosion control blanket
    and native plant plugs after final grading is complete.

Following completion of the Preserve at Oak Meadows project in 2017, the course has not experienced flooding that previously impacted playability. The methods described above allowed the contractor to isolate Salt Creek from upstream flow and restore the creek without releasing sediment downstream. The resulting project restored 6,585 ft of Salt Creek, created 25 acres of wetland and 35 acre-feet of additional floodplain storage.

Although ultimately a success, the main constructability issue with the bypass channel was the uplift, detachment and tearing of the geotextile fabric. While only two of the 51 soil borings completed onsite contained groundwater, this should have been considered due to the multi-year length of the project and, therefore, the probability of a period of high groundwater. Design modifications for future bypass channels may include specification of a geotextile fabric with higher permittivity to allow groundwater pressure relief into the channel, additional burial depth of the upstream end of each fabric segment and installation of boulders as additional weight at regular intervals along the channel. 

Figure 4: Boulders placed on geotextile fabric to prevent floating.

About the Experts

Erin Pande, PWS, CFM, is a Professional Wetland Scientist and Certified Floodplain Manager at Engineering Resource Associates, Inc. She has worked in the stream and wetland restoration field for 20 years. She performs natural area assessments and designs and implements streambank and shoreline stabilization, natural area restoration and water quality best management practice projects.

Andrew Kustusch, PE, CFM, is a Certified Floodplain Manager and a licensed professional engineer in the states of Colorado and Illinois. He currently serves as a project engineer, erosion control designer and green infrastructure specialist with Engineering Resource Associates, Inc.

Flocculant Usage Across the United States

By Billur Kazaz, MS, CPESC-IT; Michael A. Perez, Ph.D., CPESC; Wesley N. Donald, Ph.D., CPESC

Flocculants are an effective solution to improve the sediment capture performance of construction stormwater management practices. With the appropriate product selection, dosage and application, construction stormwater can be rapidly treated to remove fine-sized soil particles from suspension.1 This study investigates the use of flocculants for construction stormwater applications in the United States by presenting results from a state-of-the-practice survey. The survey was distributed to state departments of transportation (DOTs) to investigate current flocculant implementations on construction sites. The study highlights the perspective of state DOTs on using flocculants for construction stormwater treatment.

Use of flocculants with synthetic construction stormwater.

Use of Flocculants

Flocculants are water-soluble polymers that have been used by many different industry applications for solid-liquid separation purposes including water treatment, mining and construction stormwater management. Flocculation occurs as a result of a chemical process that binds small soil particles with a bridging mechanism and forms larger flakes that settle out of suspension.2 Construction stormwater management has shifted its focus on these chemical agents in a positive way for reducing erosion and treating sediment-laden runoff. Research studies show that these chemicals are highly effective in construction stormwater treatment with adequate application techniques and dosage recommendations.3-7 On the other hand, these chemicals have the potential to create risks for polluting water bodies and damaging aquatic life in case of an overdose and improper implementation.

The U.S. Environmental Protection Agency emphasizes the significance of proper dosage guidance and adequate application techniques in flocculant usage for minimizing pollution in downstream water bodies.8 Therefore, state agencies are cautious when integrating flocculants into their specifications for construction stormwater treatment. This research was performed to understand the current perspective of DOTs on flocculant selection, dosage and application guidance.

Survey Questions and Distribution

The survey was developed and delivered using an online survey platform with multiple-choice questions that primarily focused on identifying flocculant users and non-users among the DOT’s. Survey participants received questions based on their flocculant usage. Three questions were asked of the non-using agencies and up to ten questions were asked of flocculant users. Depending on their responses to questions, the survey would deviate into differing paths to ensure appropriate questions were asked. DOTs that integrate flocculants into their construction stormwater management specifications received detailed questions on usage purpose, approved flocculant types by their state, dosage and application guidance, and residual monitoring.

The survey was distributed to lead construction stormwater professionals of 51 DOTs, in 50 states and Washington D.C. The email invitation provided an anonymous link to the survey. The questionnaire was kept active for a month, and three distribution cycles were planned for reminders. Some of the participants preferred to complete the survey via phone interviews. A total of 37 agencies responded to the survey invitations and completed the survey questions by phone or online. Specifications and design manuals of non-participating agencies were reviewed to provide complete knowledge on the flocculant usage for construction stormwater treatment in the U.S.

Figure 1: Map of flocculant usage in the U.S.

Survey Findings

The state-of-the-practice survey data provided useful data for evaluating current flocculant usage in the U.S. Results indicated that 31 DOTs (61%) are hesitant on using flocculants on construction sites, with only 20 DOTs (39%) using flocculants. Figure 1 displays the map of flocculant usage in the U.S. based on the survey data and the specifications of non-participating agencies. Solid colors represent the survey data, while dashed pattern symbology represents information gathered from non-participating agency manuals and specifications. Orange-colored fill represents state highway agencies that do not allow flocculants and blue represents states that use flocculants for construction stormwater treatment.

The use of flocculants are most common in southeastern states and along the west coast of the U.S. Alaska, Connecticut, District of Columbia, Hawaii, Illinois, Kentucky, Massachusetts, Michigan, Montana, New Jersey, New York, Pennsylvania, Rhode Island and West Virginia are the states that did not respond to the survey invitation. Based on the erosion and sediment control manuals of these states only Alaska, Connecticut, District of Columbia, Illinois, New York, Rhode Island and West Virginia allow the use of flocculants.

The reasons behind the hesitation for using flocculants on job sites were investigated by the questionnaire. Fifty percent of the state agencies surveyed consider their current stormwater management practices as sufficient for treating construction stormwater. State agencies are primarily concerned about polluting downstream water bodies due to inadequate dosage and application rates.
DOTs that responded that they allow flocculant use received additional questions in the questionnaire for gathering detailed information on their perspective. The purpose of flocculant usage on job sites was asked in the questionnaire. The results showed that 12 (92% of) “flocculant allowing” agencies use these chemical agents for sediment control on construction sites and four (31%) of these agencies use flocculants as an erosion control together with sediment control to reduce soil erosion on slopes.
Survey results also indicated that the most common flocculant types preferred by state agencies are anionic polyacrylamide (PAM) (62%), chitosan (38%) and polyaluminum chloride (PAC) (23%), respectively.

Improperly applied, flocculants can be highly toxic to the downstream aquatic environment.9 Therefore, the survey also focused on understanding the current dosage and application guidance that has been adapted by the DOTs. Figure 2 (page 16) illustrates the results for the dosage and application guidance question in the survey. The results show that most of the DOTs (55%) are relying on manufacturer guidance, and 23% of responding agencies do not have any developed guidance.

The survey results identified the demand for residual monitoring on construction sites for protecting downstream water bodies from the toxic impacts of these chemical agents. Based on the survey responses, residual monitoring is required by the state agency or regulatory in only three states: California, Florida and South Dakota.

Figure 2: Survey results for dosage and application guidance.

Conclusion

The survey findings show that proper guidance for the selection and application of flocculants is needed for state highway agencies to overcome hesitations and adopt their use. The results of this study will provide valuable knowledge for further studies on flocculants to identify the research needs by presenting the perception of the state agencies for flocculant usage. Research studies can highly benefit from the state-of-the-practice survey results to understand the potential needs of the practitioners and develop effective guidance on flocculant usage.

Results show that residual monitoring, dosage and application guidance are the factors that hold DOTs back from adapting flocculants and need further investigation. The fact that most flocculants tend to be soil dependent changes their performance based on soil characteristics, therefore, manufacturer guidance might not be reliable with changing site conditions and soil types. Based upon DOT feedback, further studies focusing on developing dosage and application guidelines by conducting lab-scale and large-scale performance testing would be beneficial for the construction stormwater industry. 

References

1) Mclaughlin, R. A., and A. Zimmerman. Best Management Practices for Chemical Treatment Systems for Construction Stormwater and Dewatering. Report No. FHWA-WFL/TD-09-001. Federal Highway Administration, Vancouver, WA, 2008, p.12.

2) Dao, V. H., N. R. Cameron, and K. Saito. Synthesis, Properties, and Performance of Organic Polymers Employed in Flocculation Applications. Polymer Chemistry, Vol. 7, No. 1, 2016, pp. 11–25. https://doi.org/10.1039/c5py01572c.

3) Przepiora, A., D. Hesterberg, J. E. Parsons, J. W. Gilliam, D. K. Cassel, and W. Faircloth. Field Evaluation of Calcium Sulfate as a Chemical Flocculant for Sedimentation Basins. Journal of Environmental Quality, Vol. 27, No. 3, 1998, pp. 669–678. https://doi.org/10.2134/jeq1998.00472425002700030026x.

4) Harper, H. H., J. L. Herr, and E. H. Livingston. Alum Treatment of Stormwater: The First Ten Years. Journal of Water Management Modeling, 1999. https://doi.org/10.14796/JWMM.R204-09.

5) A. K. Bhardwaj, and R. A. McLaughlin. Simple Polyacrylamide Dosing Systems for Turbidity Reduction in Stilling Basins. Transactions of the ASABE, Vol. 51, No. 5, 2008, pp. 1653–1662. https://doi.org/10.13031/2013.25324.

6) Rounce, D., B. Eck, D. Lawler, and M. Barrett. Reducing Turbidity of Construction Site Runoff via Coagulation with Polyacrylamide and Chitosan. Transportation Research Record: Journal of the Transportation Research Board, Vol. 2309, No. December 2012, pp. 171–177.

7) Kang, J., and R. A. McLaughlin. Simple Systems for Treating Pumped, Turbid Water with Flocculants and a Geotextile Dewatering Bag. Journal of Environmental Management, Vol. 182, 2016, pp. 208–213. https://doi.org/10.1016/j.jenvman.2016.07.071.

8) The United States Environmental Protection Agency. Construction General Permit (CGP). Environmental Protection Agency, Washington D.C., 2017.

9) The United States Environmental Protection Agency. Stormwater Best Management Practice Polymer Flocculation. October 2013.

About the Experts

Billur Kazaz, MS, CPESC-IT, is a graduate research assistant pursuing a Ph.D. in civil engineering at Auburn University. Her research focuses on UAS-based aerial stormwater inspections and the use of flocculants in construction stormwater treatment. She earned her master’s degree at Iowa State University under the supervision of Dr. Michael A. Perez.

Michael A. Perez, Ph.D., CPESC, is an assistant professor in the Department of Civil and Environmental Engineering at Auburn University. His specialization includes construction and post-construction stormwater practices, methods and technologies.

Wesley N. Donald, Ph.D., CPESC, is a research associate in the Department of Civil and Environmental Engineering at Auburn University. He specializes in construction stormwater management applications and conducts research on construction stormwater practices.

Improving Soil Balance and Function in Stormwater Management

By Ted Hartsig, CPSS; Steven Polk, PE

Collection and treatment of stormwater is an exercise of managing imbalanced resources. Urban stormwater runoff focuses increased volumes of water into limited areas where it is expected to be collected and treated. The typical design response to the increased amount of water is to try and balance this system by installing engineered soils and biological systems that nature may or may not be part of a balanced a landscape. As a result, there may be unintended drainage or stormwater treatment problems that require more energy and capital to maintain over time.

Soil is the resource that most directly affects the stormwater management imbalance. Soil is often considered to be a relatively innate mechanical system meant to accept, move and manage large amounts of stormwater and releasing it slowly, removing pollutants along the way. Soil, however, must be recognized for what it is: A living, breathing, dynamic system that can treat stormwater via infiltration into the ground. But it is also a balance of physical structure, dynamic biology and chemistry. This balance is necessary for stormwater management structures and the landscapes surrounding them. Getting this balance correct is what makes stormwater management successful.

Early infiltration design guidance in most regions of the United States required sand to be used as the predominant soil type for stormwater infiltration. The reason was based primarily on “book values” that logically show sand, especially coarse sand, as having high infiltration rates. However, design guidance for stormwater best management practices (BMPs) is changing as more regional policies allow for higher silt and clay (“fines”) content in biofiltration soil mixes (BSM).1 While some regions minimize the allowance for fines in BSM materials based on the potential that fine particles will migrate and clog infiltration filters, other regions are realizing that silts and clays actually help stabilize BSM materials and help maintain consistent infiltration and percolation in stormwater BMPs for longer periods of time.2 Much of this is because of increased biological activity in bioretention stormwater management systems.3

Why Stormwater BMPs Fail

When soil is disturbed, whether by tilling the soil for agriculture, grading the soil for construction or even in blending soils for specialized BSM, the soil structure that holds sand, silt and clay particles together is often broken.4 The resulting separation of silt and clay causes these fine particles to move easily and migrate between sand particles to form clay pans. Similarly, these same fine particles are easily dislodged and eroded from nearby soils that are captured in stormwater BMPs. The result is clogging of the BSM caused by the formation of sediment layers or clay pans. Because clay tends to have more cohesive properties that bind small particles together, silt is often more easily transported to form the blocking layers. Discussion with Steven Polk, PE, with Stormwater STL LLC in St. Louis, Missouri a company that inspects and maintains hundreds of stormwater BMPs quarterly, revealed that poor soil mixtures and clogging near the surface are the main causes of bioretention basin failure. Subsequent repair of these systems can run into tens of thousands of dollars. Often, the repair is not permanent and will need to be repaired again in the future.

In contrast to sand-based BSM, soil with strong aggregated peds that are often a congregation of sand, silt and clay bound together by organic “glues,” chemical bonding, and physical adhesion are effective for stormwater management. Well-aggregated soils provide effective macroporosity through which water readily flows while also retaining micropores that hold water for plant growth and chemical exchange sites, thereby effectively removing pollutants from the water. These types of soils are maintained through active plant growth and the activities of soil microflora (bacteria and fungi) and fauna (earthworms, nematodes, insects, and more). In fact, it is the dynamic actions of plant root growth, microbial transformations and turbidation of soil by worms and other small animals that contribute to healthy soil and the development of macropores that facilitate infiltration and percolation of water. This healthy soil retains an effective stormwater management performance for several years after BMP construction.3,5,6
Maximizing the “Bio” in Bioretention

As described above, an essential factor for successful BSM in stormwater BMPs is healthy soil biology. This is not limited to plants, but also the microbial communities of the soil itself. Sand-based BSM provides the primary function of moving water into the soil but it relies on the addition of compost and possibly other performance enhancing devices to filter pollutants from incoming stormwater.7 However, studies conducted in the states of Washington and California have shown that the inclusion of too much compost in BSM often results in the release of phosphorus, nitrogen and copper into the stormwater effluent passing through the BSM.8 The growth and development of natural microorganisms, particularly fungi, will produce natural organic matter, and their activity will serve to reduce the concentrations of both organic and metal contaminants in stormwater runoff.9

Plants and soil microorganisms depend on each other for coexistence. Healthy vegetation releases polysaccharides into the soil that stimulate microbial growth and activity. Abundant microbes, in turn, provide plants with the nutrients they need to grow and be healthy. Soil bacteria and fungi also release compounds that build soil structure and promote water movement into and through the soil while also retaining important nutrients. Plants and microbes will break down organic contaminants while often assimilating and immobilizing inorganic metals, binding them long-term to soil organic matter. To make all this work, clays and silts help create the environment where soil microbes can flourish.

A balanced stormwater BMP: 12 years old and still functioning as planned.

Chemistry of a Healthy BSM

The chemical nature of the healthy BSM and a successful stormwater BMP is sometimes the most difficult to understand and manage. Healthy BSM will have slightly acidic to near-neutral pH and low salt content. The BSM should be relatively low in macronutrients (primarily nitrogen and phosphorus) because most nutrients needed for sustaining plants in the stormwater BMP are often inherent in the soil or in stormwater influent. An important part of the soil chemistry and success of the BMP is the ability of the soil to absorb nutrients as well as contaminants. This is often reflected in a measure of the soil’s cation exchange capacity (CEC). Fine-textured soils have higher CEC than do coarse, sandier soils. To make up for the low CEC of sandy soils, compost, peat or, recently, coconut coir fiber, is added to improve the CEC of sand-based BSM. These organic materials will decompose with time and must be replenished as part of the BMP maintenance program.

Balanced Soil and Successful BMPs

The “right” soil for stormwater BMPs will vary by location, as every site is different. Every stormwater BMP has different functional and environmental needs requiring the appropriate soil to support effective stormwater management. The typical engineered, sand-based soil recommended or required by many stormwater management programs is essentially a “one-size-fits-all” approach that often fails.
Every stormwater BMP has different functional and environmental needs requiring the appropriate soil that is necessary to support effective stormwater management. The use of more natural soils, especially if soils don’t have to be blended, screened or pulverized works very well. If there is a “happy medium” for stormwater bioretention, soils with sandy loam to loam texture—typically about 45% to 70% sand, 10% to 25% clay, and 15% to 35% silt—work very well. The sandy loam to loam texture has sufficient clay and silt to provide soil chemical and biological stability, yet enough sand to allow adequate drainage.
Designing BSM that has physical, biological and chemical balance is appropriate for the local environment and the proper function of each stormwater management system. This will require many designers to rethink the design of stormwater BMPs to include more natural, native soils, accept finer-textured soils and consider plants and soil biology more. 

A balanced stormwater BMP: 12 years old and still functioning as planned.

References

1) Hodgins B., Seipp B. 2018. Bioretention System Design Specifications & “Performance Enhancing Devices.” Center for Watershed Protection. Washington, D.C.

2) Shanstrom N. 2016. How Sandy Does Bioretention Soil Need to Be? Deeproot Blog Entry. April 16, 2016.

3) Ayers E. 2009. Pedogenesis in Rain Gardens: The Role of Earthworms and Other Organisms in Long Term Soil Development. Ph.D. Dissertation. University of Maryland.

4) USDA-NRCS (U.S. Department of Agriculture – Natural Resources Conservation Service). 2010. Soil Glue. https://www.nrcs.usda.gov/Internet/FSE_DOCUMENTS/nrcs142p2_051280.pdf.

5) Skorobogatov A. (2014). Hydrological Functionality of Plants and Its Application to Stormwater Management (Unpublished master’s thesis). University of Calgary, Calgary, AB.

6) Mehring A., Levin L. 2015. Potential Roles of Soil Fauna in Improving the Efficiency of Rain Gardens Used as Natural Stormwater Treatment Systems. Journal of Applied Ecology 52:1445-1454.

7) Hodgins B., Seipp B. 2018.

8) Herrera Environmental Consultants. 2020. Bioretention Media Blends to Improve Stormwater Treatment: Final Phase of Study to Develop New Specifications. Final Report. King County, Washington Department of Natural Resources and Parks. January 2020.

9) McIntyre J., Davis J., Kappenberger T. 2020. Plant and Fungi Amendments to Bioretention for Pollutant Reduction over Time. Final Report to Washington State Department of Ecology Stormwater Action Monitoring. September 25, 2020.

Special thanks to Lillian Stroeker (Olsson) for assistance with research of stormwater BMP soils

About the Experts

Ted Hartsig, CPSS, is a senior soil scientist with Olsson, Inc. in Overland Park, Kansas. His 37 years of experience have been focused on soil design and restoration for environmental and stormwater management in urban and rural locations throughout the U.S.
Steven Polk, PE, is a professional engineer and owner of Stormwater STL, a firm specializing in stormwater BMP management and compliance, offering inspection, maintenance, native plant stewardship, testing, construction and consulting expertise for stormwater quality systems in St. Louis and throughout the Midwest U.S.

MOST POPULAR