Home Blog Page 13

Avoid Delays in Construction by Keeping Sites Dry

Figure 1. Potential improvements using the RAS system.

Adverse weather costs contractors a considerable amount of money each year in the form of project delays. Globally, 45% of building projects are affected by adverse weather, leading to billions of dollars in losses.1 The most common cause of these losses is schedule overruns that are often attributable to three increasingly common weather events: extreme temperatures, high winds and precipitation.

Although a common occurrence, rain is one of the most significant contributors to project delays, specifically to projects in their early stages. The resulting mud from rain in the early stages of construction can make it increasingly difficult for workers to maneuver equipment and carry out project tasks efficiently and safely. For example, concrete used in these projects cannot be poured on wet soil, and some heavy machinery is unusable in deep mud. Therefore, progress will typically halt immediately following rain, delaying the project.

While there are existing solutions to mitigate this issue, such as sump pumps to remove standing water and plastic sheeting to protect exposed dirt, these solutions are time-consuming and not completely effective. Sump pumps can remove standing water, but once it has soaked into the ground to create mud, contractors must wait for the ground to dry. Wind can displace plastic sheeting, or water can flow past the sheeting. Currently, the most common strategy is to wait for the ground to dry naturally before progress can resume, and if the sun is not shining this could mean extended downtime that adds cost to the project.

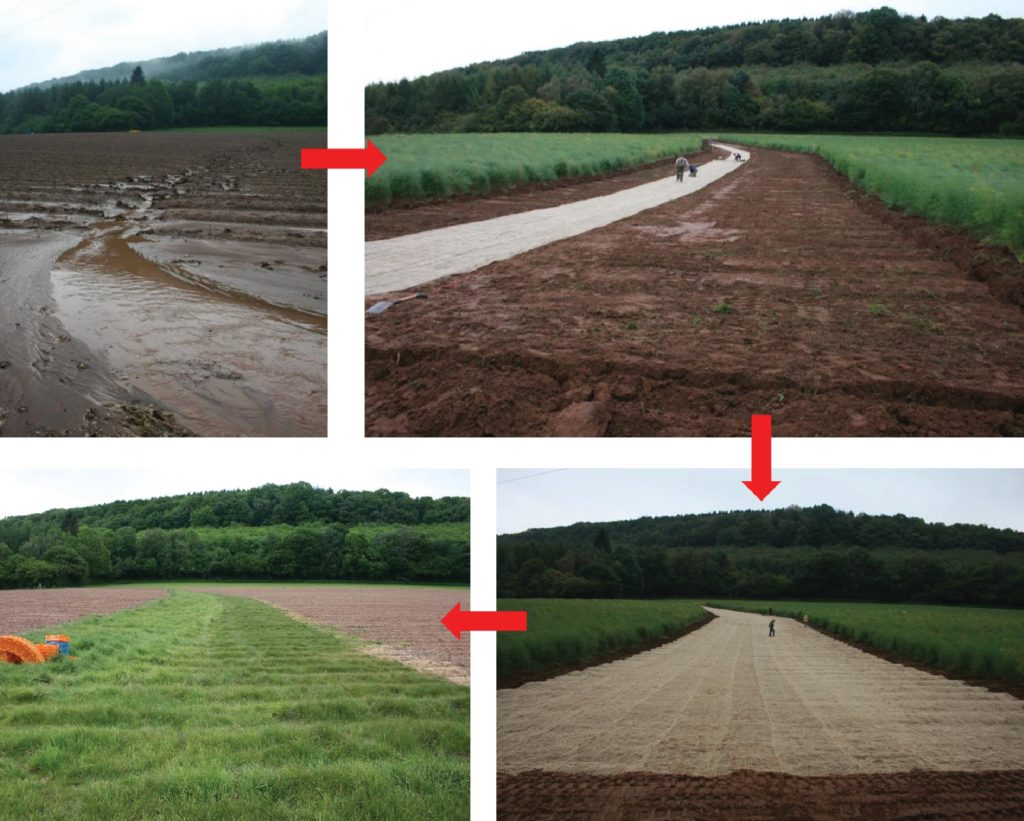
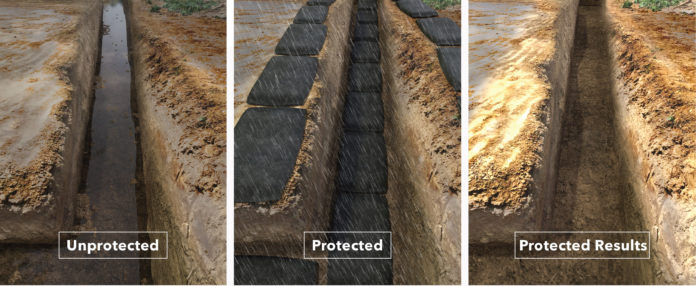
An innovative approach that stops the disruptive effects of rain on building projects is the RainWater Absorbing System (RAS). The system absorbs rainwater before it can reach the ground, which stops the rainwater from turning exposed dirt into mud (Figure 1). This preventative approach reduces the likelihood of construction delays.

Because the RAS can be reused dozens of time, it creates a more sustainable solution over plastic sheeting by reducing the amount of waste from disposal of plastic sent to the landfill. Tests were conducted to determine how many times the product can be reused without a decline in performance. Water was sprayed on a RAS bag filled with polymer granules at a rate of 473.2 ml of water over a six minute period — spray two minutes, wait two minutes, then spray again. A portable heater with a hose was used to dry the granules in a one-hour period of time, then the process was repeated. The test was stopped after 24 cycles because there was no drop in absorption capabilities.

Figure 2. The RAS bag applied on dry dirt that needs to be protected from rain.

At a cost of about $20 per bag, contractors see this system as an investment similar to scaffolding, hand tools or manufactured, reusable concrete forms. These tools and products provide a service at an initial higher cost to other, less effective or disposable options but have a much longer life cycle, thereby reducing project costs and waste. When dry, the RAS bags can be folded to a 12-inch by 12-inch by 5-inch (30 cm by 30 cm by 12 cm) size, so that dozens can easily be stored in a truck or car and pulled out as needed.

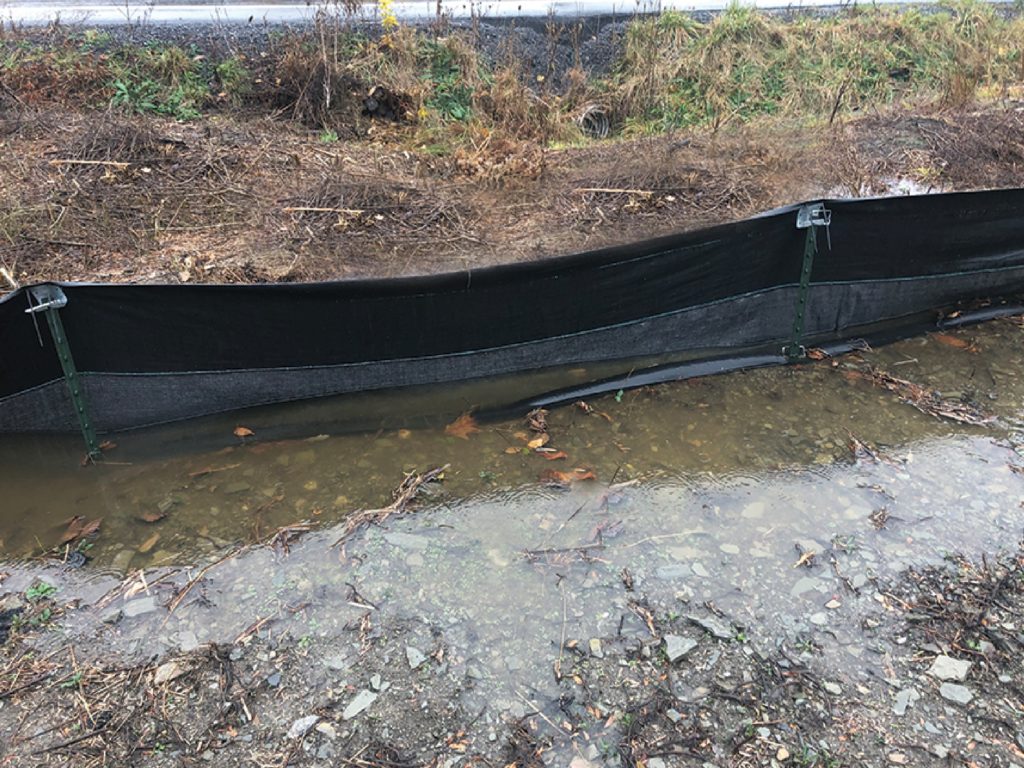
The patent pending technology uses an application bag made from a porous geotextile material that is commonly used for erosion control products on top and a waterproof material on the bottom. It contains polymer granules capable of absorbing 300 to 400 times their weight in water. The granules are the same water-absorbing polymers used in consumer products such as disposable diapers, but unlike those products that are used once, then go to a landfill, the RAS can be reused, making it more environmentally conscious.

The bag is designed to mitigate any issue of mud on the fabric affecting performance. The bottom of the bag is a waterproof material to trap the water inside until absorbed by the granules so mud does not affect its performance. The top of the bag faces up and has no contact with the mud.

Using the RAS is very simple. Before applying on the ground the RAS bags should be shaken a little to evenly distribute the SAP granules, however, they do not need to be perfectly spread out because of the waterproof bottom. The RAS bags should cover approximately 95% of the ground that needs to be protected, but 100% is not necessary since a little rainwater that makes it past will not have much effect on the dirt and the area.

Figure 3. After a rainstorm, the wet polymer granules inside have expanded.

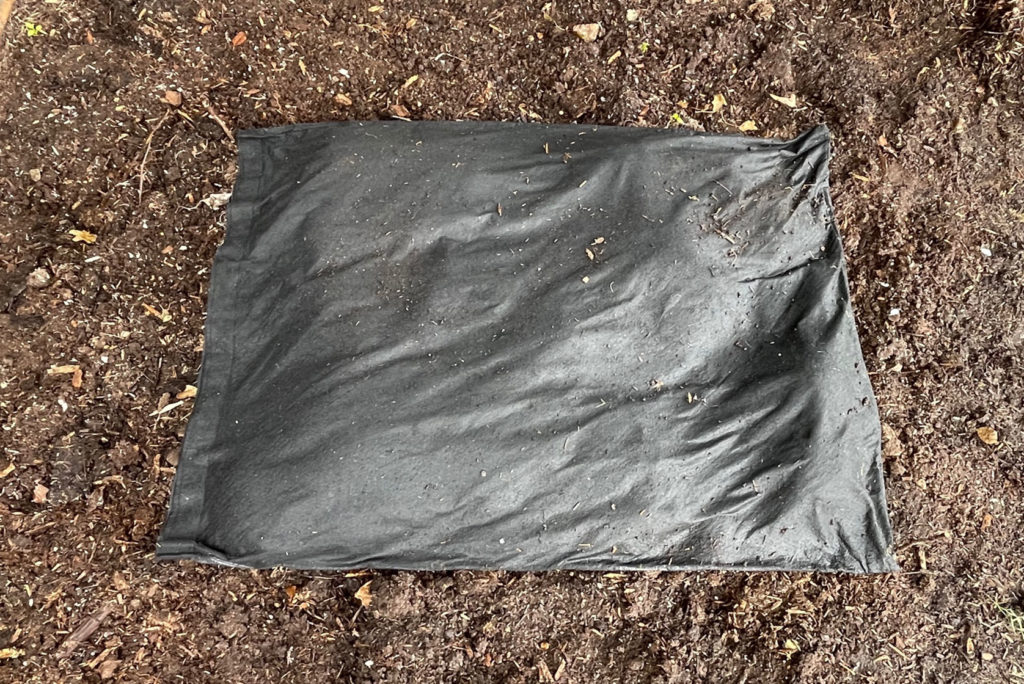
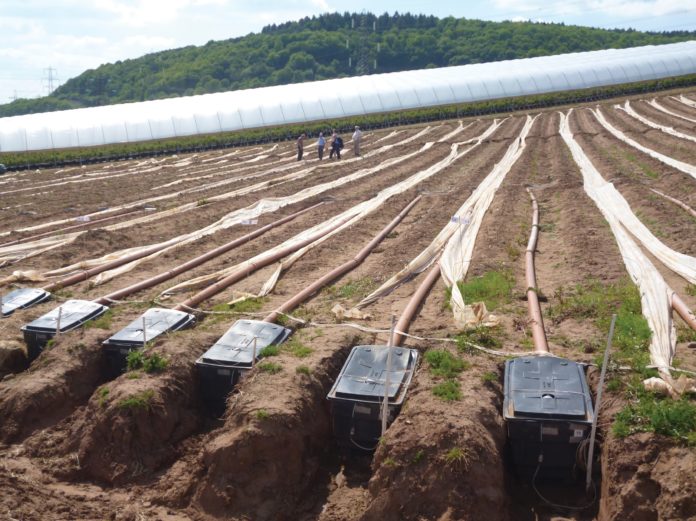
The RAS will be offered in several sizes including 2-foot by 3-foot (0.6 meter by 0.9 meter) for use in foundation trenches, along with 2-foot by 2-foot (0.6 meter by 0.6 meter) to be dropped in holes for foundation piers, and larger sizes if needs are identified. The bag can be applied in minutes to vulnerable areas of exposed dirt before the rain begins (Figure 2). As the rain falls, it is almost instantly absorbed by the polymer granules as the rainwater enters the bags (Figure 3).

The application bags are designed to handle rainfall at multiple levels — even hurricane levels — because the waterproof bottom material traps the excessive moisture inside the bag until it is absorbed. After the rain stops, the bags with the wet granules can be moved quickly, and work can be initiated again within a few minutes after the last storm ends. If the storm passes with little to no precipitation, the RAS application bags can be picked up and stored away for another day, minimizing the time lost setting up and breaking down the RAS.

Since reusing the bags will be based upon their moisture content prior to the next rainfall event, there are two options to deal with the wet granules after the storm has passed that allow contractors to choose the approach that works best for the project timeline:

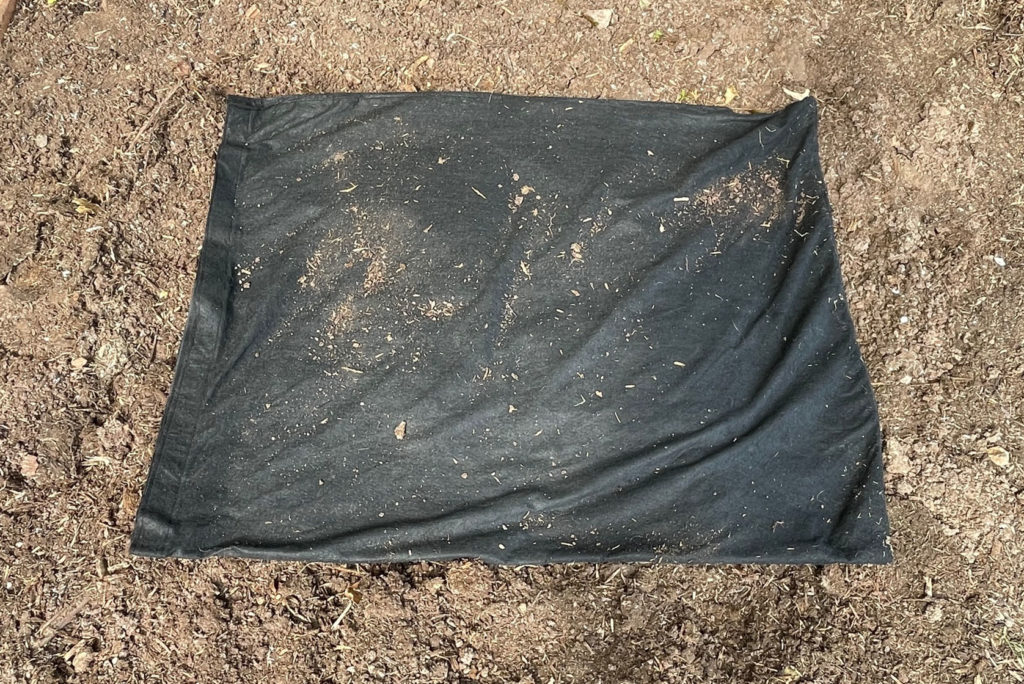
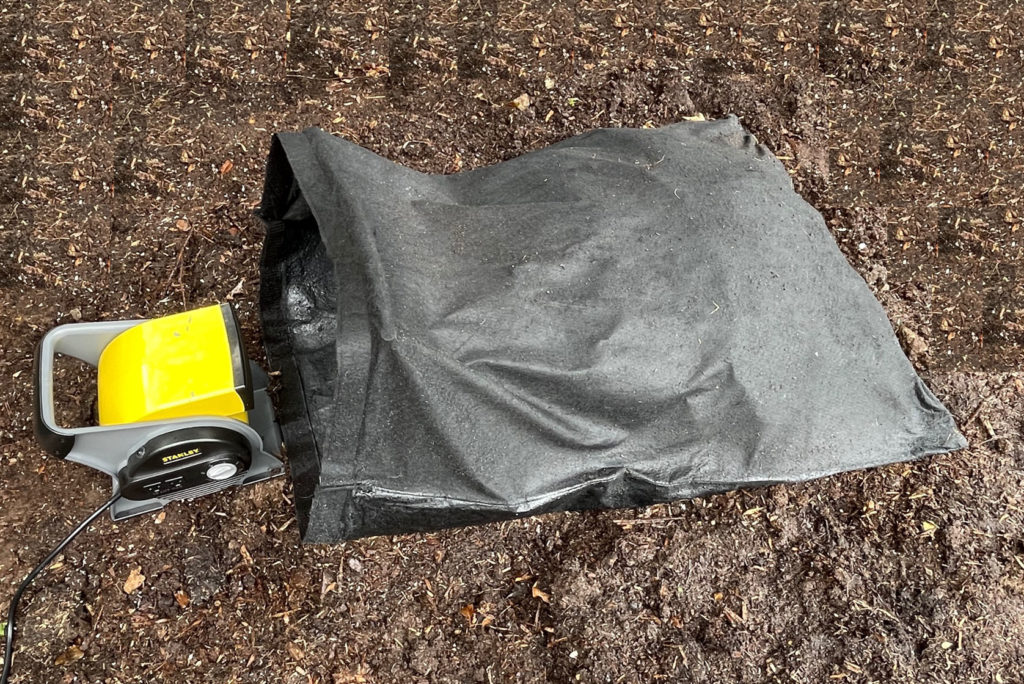
They can be dried on the jobsite in one to three hours using a simple fan to blow air inside the bag that opens up completely using a hook and loop aperture on one end (Figure 4). Exact time to dry is dependent on weather conditions, especially humidity. Testing did show that no more than three hours is needed in any condition.

The wet granules can be removed immediately after use and saved, with new granules poured in the old application bag making it immediately ready for the next storm. This saves the builder the time required to dry wet granules.

Figure 4. Drying wet granules with a fan blowing into the bag.

When storing the wet SAP granules onsite the contractor needs to make sure that more water cannot reach the granules or that they cannot wash away. One option is to dump all the granules on a tarp and fold it over a few times securing the edges down with bricks or rocks. This method also allows the contractor to dry them using the sun. When the sun is shining, unfold the tarp and let Mother Nature do all the work. The financial investment in the granules and RAS as well as the need to have the product available to protect the jobsite are incentives for contractors to manage the storage, drying and use of the RAS appropriately.

The cost savings of reducing downtime with the RAS scale with the number and scope of projects undertaken by a construction company. While larger projects may realize larger savings, small contractors can also benefit because the RAS translates into fewer lost workdays.

For example, if a masonry contractor who usually makes $500 per day used RAS for 48 storms in a year and saved 96 days based on two days per storm that they lost without the use of RAS, this would translate to an additional $48,000 in annual revenue.

Anticipating problems is a key part of planning any construction project, and RAS is the first erosion control product that addresses the challenge of mud on a construction jobsite by solving the problem before it becomes a problem. 

More Information

More product information can be found at www.RainWaterAbsorbingSystem.com. The system was recently profiled on the CBS The Henry Ford’s Innovation Nation Show and can be viewed on YouTube at: https://www.youtube.com/watch?v=yo14j84gcAE.

Reference:

de Paor, R. Wind, rain, temperature and construction contracts: How to provide for climate change in your engineering and construction project. 2021, April 27. JD Supra. Retrieved September 27, 2022, from https://www.jdsupra.com/legalnews/wind-rain-temperature-and-construction-9918027/

About the Expert

Locke White is an inventor in Blacksburg, Virginia. Over the years, he has worked with Procter & Gamble, Unilever, Toro, Hasbro, Nike, Staples and others on a variety of new product concepts.

Creating Water Quality Value in Ground-Mounted Solar Photovoltaic Sites

Figure 1. Experimental PV-SMaRT site in Minnesota.

Climate change poses an existential threat to ecosystems and the human, animal, insect and plant life living in them as a result of increasing temperatures and changes in precipitation patterns. As a result, there is a significant shift away from non-renewable to renewable energy. At the start of 2022, over 670 gigawatts (GW) of large-scale ground-mounted solar photovoltaic (PV) projects across the U.S. were in the “interconnection queue” — 10 times the total amount of existing large-scale solar (62 GW). If developed, this would be approximately 1.5 million hectares of land, most of it in rural watersheds.

To meet this market demand and see this level of solar development, regulators and developers need to have the same expectations, grounded in scientific understanding, of stormwater and water quality risks. Different jurisdictions, particularly at the local level, treat ground-mounted PV development very differently, not infrequently being treated as impervious surfaces similar to a roof or parking lot. Permitting practices frequently ignore the disconnected pervious soils beneath and between solar arrays. This leads to an overestimation of runoff and an increase in costs related to installing structural practices to mitigate runoff.

The PV-SMaRT Project

Developers and local or state permitting authorities currently do not have models and tools to properly estimate stormwater runoff from ground-mounted solar PV sites with disconnected pervious soils. To address this gap in knowledge, the Department of Energy (DOE) provided funding to the National Renewable Energy Lab (NREL), the University of Minnesota (UofM) and the Great Plains Institute (GPI) to develop a runoff calculator and recommend best practices for estimating and mitigating stormwater runoff at ground-mounted solar PV sites. The objectives of the Photovoltaic Stormwater Management Research and Testing (PV-SMaRT) project include:

  1. Developing and disseminating a research-based tool for estimating stormwater runoff.
  2. Identifying best practices for stormwater management at ground-mounted PV facilities.

PV-SMaRT Runoff Calculator

The project team developed an easy-to-use calculator to estimate stormwater runoff from ground-mounted solar PV facilities. This calculator was based on research and hydrologic modeling conducted at five solar PV sites located in Colorado, Georgia, Minnesota, New York and Oregon (Figure 1). Sites represent diverse climatic, topographic and soil conditions, with either fixed or tracking solar arrays, and vegetation that included pollinators, grass or cover crops. Ground truth climatic and hydrologic measurements at each site were used to develop a two-dimensional numerical model for stormwater runoff based on specific combinations of a wide range in 24-hr design storms, soil textures, crop rooting depth, soil bulk densities, presence or absence of solar arrays, spacing of solar arrays, type of ground cover and slope steepness values. The numerical model was capable of accounting for the complex three-dimensional nature of precipitation, drip edge redistribution of rainfall, infiltration, runoff and evapotranspiration in the disconnected pervious areas below and between solar arrays (Figure 2).

Figure 2. Graphical depiction of complex 3-dimensional nature of hydrology at PV facilities with disconnected pervious surfaces.

Building Best Practices

The project team also evaluated existing practices used by permitting officials and regulators to measure stormwater and water quality risks, assessed barriers to improving solar and water quality outcomes, and recommended best practices for regulators and solar projects that reflect PV-SMaRT research and modeling findings (Figure 3).

There are recognized cost tradeoffs of increasing panel heights to accommodate the establishment of pollinator plantings. Anecdotally, there can be a 1%–2% increase in overall project costs to accommodate higher panels, but this can be mitigated by cheaper seed mix options and reduced vegetative operation and maintenance costs over the life of the project. Denser vegetation can lead to increased infiltration of water on-site that can reduce stormwater runoff mitigation costs while offsetting the cost of raising the panels and establishing the vegetation, but this has not been quantified. There are commercially viable projects with varied panel height ranges and vegetated cover, so evaluation of these tradeoffs needs to be studied in further depth.

Barriers in existing practices included: use of non-solar-specific standards and curve numbers, disincentives in final stabilization requirements to establishment of ground covers that maximize long-term water quality benefits, and lack of consideration of watershed and green infrastructure benefits of solar development in agricultural watersheds for impaired waters.

The PV-SMaRT research and modeling show that four factors need to be considered in stormwater management and water quality permitting (in order of greatest impact):

  1. Limit or mitigate compaction of soils during construction and in post-construction maintenance.
  2. Incorporate crop rooting depth and the site’s infiltration capacity into site design.
  3. Emphasize deep-rooted, self-sustaining ground covers that reduce bulk density, limit need for long-term mowing and provide the community ecosystem co-benefits.
  4. Ensure sufficient separation of arrays to sufficiently disconnect array commensurate with site conditions.
Figure 3. Example of panel heights and their potential influence on vegetation and rooting systems.

Summary

The PV-SMaRT calculator can be used to evaluate impacts of site-specific characteristics (crop rooting depth, soil bulk density, slope, vegetative cover for a range of array spacings) on runoff curve numbers at ground-mounted solar photovoltaic facilities. Resultant curve numbers can then be used to calculate expected stormwater runoff from a single 24-hour design storm specified by the user. The calculator can be used to estimate runoff based on pre-construction characteristics (without arrays, with pre-construction vegetation), as well as runoff based on post-construction characteristics (soil compaction, different types of vegetation, etc.).

The PV-SMaRT calculator provides more accurate estimates of runoff curve numbers at ground-mounted solar PV sites than using the NRCS Runoff Curve Number (RCN) lookup tables. In general, the NRCS RCN method overestimates stormwater runoff generated at ground-mounted solar PV sites relative to the PV-SMaRT calculator. This is understandable, because the NRCS RCN approach is unable to properly account for the disconnected pervious nature of solar PV facilities. The calculator will soon be publicly available; check the project website at www.nrel.gov/solar/market-research-analysis/pv-smart.html for updates.

The calculator and the research and modeling behind it are the basis for new best practices now under development, to inform regulators and permit officials, as well as solar developers and EPC contractors. Maximizing water quality benefits and creating consistent and transparent permitting process will require new approaches to regulation and new planning and business practices by the solar industry. The end result will create predictability in stormwater permitting, improved water quality outcomes for host communities, and new ecosystem co-benefits. 

About the Experts

David Mulla, Ph.D., is the Larson Chair and Professor for Soil & Water Resources in the Department of Soil, Water and Climate at the University of Minnesota. His research emphasizes hydrology, precision conservation, and ecosystem services modeling.

Jake Galzki, M.S., is a researcher in the Department of Soil, Water and Climate at the University of Minnesota. His current research focuses on soil and water quality monitoring, modeling and conservation.

Aaron Hanson, M.S., is an energy program specialist for the Institute on the Environment and a Teaching Specialist for the Department of Bioproducts and Biosystems Engineering at the University of Minnesota. His work is focused on a systems-based approach for the transition to a clean energy future.

Brian Ross, AICP, LEED GA is a vice president of renewable energy at the Great Plains Institute. He leads GPI’s renewable energy market transformation efforts in the Midwest and nationally and is developing work on non-electric integration of renewable energy systems.

Restoring Lakes with Proper Dredging Plans, Tools and Processes

Figure 1. Lake before dredging to remove vegetation and debris. (Photo by Painted Tree and Open Space TX)

A connection to nature is a key marketing strategy for the developers of Painted Tree, a 1,000-acre master-planned community in McKinney, Texas. With 69% of potential homebuyers in the Dallas-Fort Worth metroplex ranking walking trails as the most desired community amenity and 63% of potential homebuyers rating lake, pond and water features highly1, the property’s existing lake provided the perfect centerpiece for the property’s recreation and walking trail plans.

The 20-acre lake, however, required care before it could become the water feature that tied the community’s nature-focused plans together.

The land had not been used for a number of years before the developer bought it, so there was no maintenance of the lake, dam and surrounding land. There was a lot of vegetation as well as willow trees in the middle of the lake, and it was only 5 to 10 feet deep in some spots (Figure 1).

The first step was to remove vegetation to restore the lake to what it had been. Care had to be taken around the dam, but most of the vegetation was in the middle of the lake, so the risk to the dam was minimal. An excavator bucket with a thumb on a barge was used to reach the areas in which the vegetation was located (Figure 2). Material barges and boats were used to transport the material to the bank for landscapers to mulch and recycle throughout the development. Because there were no dredge spoils, just trees, there was no need for any erosion control BMPs.

The project was completed in 30 days, with crews working 12 hours per day, seven days a week.

Figure 2. Dredging equipment on a barge was used to remove vegetation. (Photo by Painted Tree and Open Space TX)

Dredging to Increase Depth of Lakes or Waterways

While there was no removal of sediment to further deepen the lake at Painted Tree, it is a process that can be used to restore lakes in addition to the removal of vegetation.

One of the concerns about the dredging process is unwanted turbidity, or the generation of fine sediment that will travel downstream or collect on the banks of a lake. Capturing the silt and sand to control it can be accomplished in several ways, similar to the use of silt fence on land. On the Painted Tree project, turbidity curtains were used around the dredge area and the dam outfall to prevent sediment from moving downstream.

Also known as floating silt fences, turbidity curtains are assembled on shore and the floating elements are towed into place. Once in place, the system is anchored to the floor of the lake and the skirts are released to form the curtain. The type of curtain and anchor system used are determined by the type of project, whether or not currents are an issue, location of dredging activity and access to the site.

Another way to control turbidity, when significant vegetation is not an issue, is to pump dredge spoils directly into geotextile tubes or bags. Once the material dewaters, the dry spoils can be used to restore beach or shoreline.

The benefits of dredging vary with the type and location of the body of water:

Maintains or increases depth of navigation channels in rivers and harbors.

Reduces the exposure of fish, wildlife and people to pollutants introduced from municipal or industrial discharges, sewer overflows, surface runoff or atmospheric deposition.2

Restores recreational access to the community.

Improves habitat for aquatic life by deepening lakes and removing contaminants.

There are also concerns that dredging can negatively affect aquatic life with the noise, sediment plumes and degradation of habitats, but these effects can be minimized with careful planning. Two studies suggest that turbidity is not a problem but timing is important to avoid disruption of spawning areas.3,4 In fact, one project in Michigan was designed to deepen a lake in order to provide more spawning grounds for fish. Scheduling a project in the environmental windows when fish or other aquatic life are not actively spawning is an important part of the planning process.

Other environmental factors that must be considered when dredging are structures that may be hidden by the water. In Texas, it is important to be aware of oil and gas pipelines that may be underground around a lake but are exposed on the lake floor.

Figure 3. Lake just before final vegetation was removed. (Photo by Painted Tree and Open Space TX)

Regulatory Challenges

The project at Painted Lake presented no specific challenges for permits and required no avoidance, minimization or mitigation measures because there was no sediment removal. In other projects, however, steps must be taken to meet permitting requirements, and they must be considered early in project design.

To ensure that the proper environmental controls are considered, a best practice for any construction project that includes dredging is to consult with a dredging contractor early in the planning stage. One of the most difficult and time-consuming steps in a dredging project is the permitting process. While the Federal Clean Water Act requires the U.S. Army Corps of Engineers to regulate dredging in accordance with environmental criteria, there may also be state and local regulations with which a contractor must comply. Permit applications must include drawings of the work to be done, including cross sections of before and after conditions, as well as disposal plans for material removed. These permits can take between six months and one year to be approved.

In addition to acquiring the permitting expertise of a dredging contractor, early involvement in the planning process allows the contractor to provide input into the design of a project to ensure that the appropriate access to the site for equipment and crews is provided. This also allows the contractor to accurately estimate the cost of equipment, supplies and labor for the project budget.

Dredging is a specialized, carefully regulated industry with a focus on balancing environmental concerns and the need for clean, navigable waters for commerce and enjoyment. Innovations in equipment to reduce noise and minimize turbidity along with processes to protect aquatic life are ongoing. 

References

Jaimes M. McKinney’s Painted Tree community unveils plans for paths, trails, other amenities. Community Impact. June 9, 2021.

NOAA. What is Dredging? National Ocean Service website. https://oceanservice.noaa.gov/facts/dredging.html.

Todd V, Todd I, Gardiner J, et al. (2014). A review of impacts of marine dredging activities on marine mammals. ICES Journal of Marine Science. 72. 10.1093/icesjms/fsu187.

Wenger AS, Harvey E, Wilson S, et al. (2017). A critical analysis of the direct effects of dredging on fish. Fish and Fisheries. https://doi.org/10.1111/faf.12218.

About the expert

Rusi Patel is general manager of Viking Dredging.

Innovative Approach to Sediment Control Reduces Landfill Disposal Weight

Figure 1. Trenchless Silt Fence requires no digging to install.

Sediment is the number one pollutant of U.S. water resources even though sediment control is commonly required to comply with National Pollution Discharge Elimination System (NPDES) regulations. Sediment-retention devices (SRDs) include silt fence, silt socks, wattles, filter logs, compost and earthen berms and storm inlet protectors. SRDs retain sediment from disturbed land until revegetation and permanent soil stabilization begin without the large area required by settlement ponds.

While each of these SRDs has their own advantages and disadvantages for installation, maintenance and control of sediment, another factor to consider is the amount of waste sent to landfill from used SRDs at the completion of a construction project. Use of a new technology — a Trenchless Curved Silt Fence (TCSF) — reduces landfill disposal by 81% compared to the super silt fence and 98% compared to the 24-inch (61-cm) compost filter sock.

Figure 2. Reusable stakes and sand tubes reduce costs and amount of material in landfills.

Silt Fences

Silt fences are a popular SRD because the materials are inexpensive and can pool rainwater up to 24 inches (61 cm) or more to allow the accumulated sediment to settle out while slowly filtering the rainwater. A single 100-foot (30.48-m) run of silt fence can hold back 50 tons (45.359 mt) of sediment and water.

A silt fence is composed of a permeable geotextile, such as woven, non-woven and mono-filament plastics, stretched between wooden or metal posts driven into the ground in regular intervals on the downhill side of the silt fence. The geotextile acts as a surface filter so the pores clog quickly to hold the rainwater back while the sediment settles out. In traditional silt fences, the bottom of the geotextile must be trenched (e.g., 6 inches (15.24 cm) wide by 6–8 feet (1.8 to 2.4 m) deep on the uphill side) or static-sliced (e.g., 12-inch (30.48 cm) deep slit) into the ground to prevent rainwater from running underneath. Both trenching and static slicing are affected by roots and rocks below the ground surface, as well as terrain contours or property lines, and require ground compaction afterward to prevent rainwater from eroding the trench.

A wire or chain-link fence can be placed behind the geotextile to reduce stretching due to hydrostatic pressure. When backed by chain-link, this system is referred to as super silt fence, which may double the cost of the silt fence installation and entails disposing of more material in a landfill when removed. Compared to traditional silt fence and super silt fence, the TCSF is more resistant to poor installation techniques since trenching and compaction are not needed. The TCSF also has reusable stakes and sand tubes that reduce future installation costs and the amount of material sent to the landfill.

Figure 3. Diagram showing the installation of the Trenchless Curved Silt Fence with t-posts, brackets, curved silt fence, sand tubes and bottom plates.

Compost Filter Socks

Another popular SRD to achieve 15 to 26 inches (38.1 to 66 cm) of ponding is compost filter socks held in place with wooden stakes driven through the top of the tube into the ground below. The compost- and wood-chip-filled versions are extremely heavy to transport for installation and removal, so larger diameter socks are filled at the construction location. This process requires numerous truckloads of compost or a nearby source of woodchips. If approved by the landowner, compost socks can be cut open when no longer needed so that only the fabric tube is sent to the landfill. The woodchip socks, however, are acidic and inhibit revegetation when cut open so they either need to be removed or the woodchips must be neutralized into the soil. Compared to compost filter socks, the TCSF uses less raw material with lower associated transportation and landfill costs. The disposal weight of a 28-inch (71-cm) TCSF is 0.5 lbs./ft (0.677 J) compared to 80 lbs./ft (108.5 J) for a 32-inch (81.28-cm) compost sock.

Trenchless Curved Silt Fence

The Trenchless Curved Silt Fence (Figures 1 and 2) overcomes the tipping and trenching disadvantages of silt fence and the weight and volume disadvantages of compost sock while providing up to a 55% reduction in materials, installation and removal costs compared to 24-inch (61-cm) compost filter sock and up to a 40% reduction compared to super silt fence.

The patented design includes a sand tube ground seal and a curved cross-section. The sand tubes, which eliminate trenching, slide into a bottom pocket to seal the base of the fence to ground while t-posts and ground plates anchor the system in place (Figure 3). The sand tubes are covered in hydrophobic scrim that resists absorbing water, to prevent water logging and freezing, both while in storage and in use. The woven inner layer of the sand tube provides durability and resistance to drops, punctures and tears. The first flush of sediment-laden rainwater provides a second seal to the ground as it flows over the ground plates and behind the sand tubes.

The TCSF is constructed with two plies of woven slit-film geotextiles ultrasonically bonded together. The 32.4 gpm/sf geotextile (grey) is used on the fill slope side with the AASHTO M-266, NTPEP-tested, 16.4 gpm/sf geotextile (black) behind. The two-ply construction is substantially stronger and exceeds AASHTO M-288 unsupported silt fence fabric tensile, tear, burst and puncture resistance. The two-ply construction replaces the need for wire or fence reinforcement and has a soil retention effectiveness of 94.26% and seepage effectiveness of 91.07% (ASTM D-7351).

The two-ply construction also provides a filtering efficiency of 96.3% with an increased slurry flow rate slurry flow rate of 0.464 gpm/sf (ASTM 5141), which is 55% greater than the 0.3 gpm/sf requirement for traditional silt fence and super silt fence. The increased slurry flow rate and increased filter area per effective height (curved cross-section) enbles the TCSF to handle rainfall on slopes that would normally require super silt fence. An addional benefit of the TCSF is a 29%–43% reduction in ponding volume behind the silt fence to reduce area flooding.

Unlike traditional silt fence and super silt fence that rely on the stakes to resist tipping over, the TCSF has a curved cross-section beyond the t-post to transfer hydraulic force into ground. The curved cross-section is obtained by ultrasonically welding two woven polypropylene fabrics together and shortening the up-slope fabric to maintain a curve under hydrostatic pressure. This dam design of decreasing radii increases tipping stability by 380% compared to 33-inch-high super silt fence. The onion shape uses the water weight behind the stake as part of a dam wall to reduce the tipping force on the post.

Trenchless installation benefits include:

Undisturbed surrounding soil during installation and removal.

  • Year-round installation in frozen, wet, compacted or rocky soils.
  • Low impact on tree root structures.
  • No heavy machinery for trenching, static slicing and post-hole digging.
  • Easily installed on steep slopes, wetlands and hard terrain.

The TCSF has been approved as an alternative BMP by the Pennsylvania Department of Environmental Protection. As the focus on environmental protections grow, the importance of looking “downstream” to enhance control of sediment, minimize increasing weight in landfills, improve the ease of installation of SRDs and manage costs increases the importance of continued innovation in all products used in the sediment and erosion control field. 

More Information

Testing results, references and more product information about the Trenchless Curved Silt Fence can be obtained at newpigenergy.com/products/trenchless-curved-silt-fence or by calling 855.744.5463.

About the Expert

Beth Powell is president of Fluid Conservation Systems and previously served as president of New Pig Energy.

The Importance of Soil Resources: Overlooked and Undervalued?

Figure 3. Use of soil erosion plots to measure runoff and sediment from agricultural land.

“The thin layer of soil covering the earth’s surface represents the difference between survival and extinction for most terrestrial life.”1 This quote demonstrates the vital importance of soils to human existence, by delivering multiple goods and services to all of society. These soil-dependent benefits include agricultural production (e.g., food, fibre, fodder and biofuels), water storage and supply (to mitigate droughts and floods), carbon sequestration (to regulate CO2 emissions and associated global warming) and habitat protection (to support biodiversity). Soil is also a key natural asset that supports green infrastructure in urban areas, provides recreation and amenity opportunities, and protects buried cultural heritage. Indeed, soils have been linked to many of the United Nations’ Sustainable Development Goals (UN SDGs) which currently drive international governments’ policies related to Zero Hunger, Good Health and Well-being, Clean Water, Clean Energy, Climate Action and Life on Land (Figure 1).2

Despite our reliance on soils, this precious resource is often overlooked and undervalued by many land-based industries. Some of the terms we use for soil (e.g., dirt, muck, waste) even have negative connotations. On the other hand, the concept of soil health or soil quality is gaining increasing interest and acceptance, as the true value of soils becomes more apparent.

Figure 1. Relevance of soil and land degradation to the United Nations’ Sustainable Development Goals. (Adapted from IPBES, 2018)

The Concept of Soil Health

Soil health is defined as “the capacity of soil to function, within natural or managed ecosystem boundaries, to sustain plant or animal productivity; maintain or enhance water quantity and quality; and support human health and habitation.”3 In simple terms, it is the soil’s fitness for any given use, be it food production, carbon storage, water storage or soil erosion control. Soil health is related to the physical, chemical and biological soil properties, which affect soil processes or functions and the associated delivery of goods and services. For example, the property of soil structure affects the process by which the soil receives, retains and releases rainfall, and thus how that soil can mitigate against drought and flooding events (Figure 2).

The concept of soil health is commonly used in relation to agricultural soils, but it is less well-known in other land-based industries, such as construction and mining, where soil is also important. Cranfield University is working with non-agricultural sectors to highlight the importance of healthy soils beyond only farmers’ fields. For example, commissioned by the UK’s Construction Industry Research and Information Association (CIRIA), we helped develop a prototype decision support tool to assist in the selection of sustainable soil management practices, such as better handling of soil stockpiles on construction sites, to reduce waste, which is sometimes disparagingly known as “muck away” and enhance soil health. We also contributed to the Society for the Environment’s influential Soils and Stones report, highlighting the need to recognise soils as valuable resources and materials, rather than to be mistreated and/or discarded as waste materials.4

Figure 2. The relationship between soil properties, soil processes/functions and the delivery of ecosystem goods and services.

Managing Healthy Soils

Cranfield University works with practitioners from all land-based industries to design, test and implement cost effective, practical and sustainable land management practices that improve soil health. Following the expression “prevention is better than cure,” the first step is to reduce any threats to soil health, namely soil degradation processes, in the form of soil erosion, soil compaction, loss of soil organic matter, loss of soil biodiversity, salinisation, acidification, etc.5

In the agricultural sector for example, soil losses by sheet, rill and gully erosion cause loss of crop yields on-site (i.e., where the erosion event takes place), as well as several off-site impacts. These include emissions of CO2 as buried soil carbon is exposed to the atmosphere by topsoil erosion; increased flooding due to sedimentation of eroded soil in watercourses; and declines in water quality due to turbidity from eroded soil particles and from pollutants or contaminants attached to the sediment. In vulnerable areas of the United Kingdom, soil erosion rates can typically be 15 t ha-1 yr-1 (6 tons acre-1 year-1)6 compared to soil formation rates estimated at only 1 t ha-1 yr-1 (0.45 tons acre-1 year-1).7 The economic cost of soil erosion in England, Scotland and Wales alone has been estimated at £262 million per annum ($308 million).8 This is likely to be an underestimate, especially as the effects of climate change are likely to increase soil erosion rates further, due the increase frequency and duration of high intensity, erosive rainfall events.9,10

Working with farmers, researchers at Cranfield University have demonstrated that erosion control measures such as mulching and reduced tillage intensity can significantly reduce soil losses on agricultural fields by 53% to 72% compared with previous practices11 (Figure 3). Other measures being evaluated include mulching, direct drilling12, strip tillage, erosion control blankets13 and use of field engineering features such as grassed waterways14 (Figure 4) and field buffer strips. Some of these practices were originally devised for other land uses, including construction, urban and mining sites. Others have potential use outside of agriculture such as the use of grass swales in sustainable urban drainage schemes.

Once soil degradation is controlled, agricultural soil health can be built up over time. The current trend is to use practices collectively known as “regenerative agriculture” (Figure 5). Focusing on soils, this concept extends the original scope of traditional soil conservation, whereby the preservation and protection of soil alone are insufficient to meet the increasing demands for soils to deliver multiple ecosystem goods and services to society. Soil regenerative practices include the use of cover crops in the agricultural rotation, in between the main commercial crops, to improve soil physical, biological and chemical properties. For example, cover crops improve soil structure through extensive root networks. They provide habitats for soil microorganisms and build up soil organic matter content, a vital indicator of soil health.15

Figure 4. Stages of installing a grass waterway on agricultural land. (Source: R.W. Simmons)

Conclusion

Despite being referred to as “dirt” or “muck,” soils deliver an incredible range of vital goods and services to society. However, this is only possible when soils are in a healthy state. Soil degradation processes threaten a soil’s capacity to function and provide us with food, water regulation, biodiversity, climate change mitigation and numerous cultural benefits. There is much to be gained from practitioners and researchers working together across the land-based disciplines of civil engineering, geotechnics and agriculture to share and apply best management practices that create and support better functioning, healthier soils. 

About the Expert

Jane Rickson, Ph.D., CEnv, FIAgrE, FHEA is a professor of soil erosion and conservation at Cranfield University, UK. With over 35 years international experience in soil and water engineering, supported by government and industry, her research designs and implements cost-effective, sustainable land management practices.

References

Doran, J. W., & Parkin, T. B. (1994). Defining and assessing soil quality. In D. C. C. Doran D. F. Bezdicek & B. A. Stewart (Ed.), Proceedings of a symposium on defining soil quality for a sustainable environment (pp. 3–21). Soil Science Society of America / American Society of Agronomy.

IPBES. (2018). The IPBES assessment report on land degradation and restoration. (L. Montanarella Scholes R. and Brainich A, Ed.).

Karlen, D. L., Mausbach, M. J., Doran, J. W., Cline, R. G., Harris, R. F., & Schuman, G. E. (1997). Soil quality: a concept, definition, and framework for evaluation (a guest editorial). Soil Science Society of America Journal, 61(1), 4–10.

Society for the Environment. (2021). Soils and Stones Report: Sustaining Our Future by Influencing Change in the UK and Beyond. Society for the Environment–Soils and Stones Task Group. https://cdn.ymaws.com/socenv.org.uk/resource/resmgr/files/soilsandstones/21FINAL_Soils_and_Stones_rep.pdf.

European Commission (2006). Proposal for a Directive of the European Parliament and of the Council establishing a framework for the protection of soil and amending Directive 2004/35/EC. Directive (COM (2006) 232), 0086, 30. http://eur-lex.europa.eu/LexUriServ/LexUriServ.do?uri=COM:2006:0232:FIN:EN:PDF%5C
http://scholar.google.com/scholar?hl=en&btnG=Search&q=intitle:Proposal+for+a+directive+of+the+European+Parliament+and+of+the+council+establishing+a+framework+for+the+protec.

Owens, P. N., Rickson, R. J., & Clarke, M. A. (2006). Scoping study of soil loss through wind erosion, tillage erosion and soil co-extracted with root vegetables. Objective 3 deliverable: Review of how appropriate current mechanisms and advice on best practice for control and mitigation of erosion is to wind. Final Report. Report to Department for Environment, Food and Rural Affairs.

Verheijen, F. G. A., Jones, R. J. A., Rickson, R. J., & Smith, C. J. (2009). Tolerable versus actual soil erosion rates in Europe. Earth-Science Reviews, 94(1–4), 23–38. https://doi.org/10.1016/j.earscirev.2009.02.003.

Graves, A. R., Morris, J., Deeks, L. K., Rickson, R. J., Kibblewhite, M. G., Harris, J. A., Farewell, T. S., & Truckle, I. (2015). The total costs of soil degradation in England and Wales. Ecological Economics, 119, 399–413.

Li, Z., & Fang, H. (2016). Impacts of climate change on water erosion: A review. Earth-Science Reviews, 163, 94–117.

Nearing, M., Jetten, V., & Stone, J. (2005). Special issue: Soil erosion under climate change: Rates, implications and feedbacks – Introduction. Catena, 61(2–3), 103–104. https://doi.org/10.1016/j.catena.2005.05.010.

Niziolomski, J. C., Simmons, R. W., Jane Rickson, R., & Hann, M. J. (2020). Efficacy of mulch and tillage options to reduce runoff and soil loss from asparagus interrows. Catena, 191. https://doi.org/10.1016/j.catena.2020.104557.

Giannitosopoulos, M., Burgess, P. J., & Rickson, R. J. (2019). Effects of conservation tillage systems on soil physical changes and crop yields in a wheat-oilseed rape rotation. Journal of Soil and Water Conservation, 74(May/June 2019), 247–258. https://doi.org/doi:10.2489/jswc.74.3.247.

Rickson, R. J. (2002). Salient properties of erosion control geotextiles. Adventures in Erosion Education, Proceedings of the 33rd IECA Conference, 497–506.

Lees, C., de Baets, S., Rickson, J., & Simmons, R. W. (2020). Selecting plant traits for soil erosion control in grassed waterways under a changing climate: A growth room study. European Journal of Soil Science. https://doi.org/10.1111/ejss.13045.

Storr, T., Simmons, R. W., & Hannam, J. A. (2019). A UK survey of the use and management of cover crops. Annals of Applied Biology, 174(2), 179–189. https://doi.org/10.1111/aab.12488.

Reducing Pollutants from Construction Activities for Five Decades

The enactment of the Clean Water Act 50 years ago introduced an ambitious program to eliminate pollutant discharges from point sources. While stormwater point sources were not initially regulated as part of the National Pollutant Discharge Elimination System (NPDES) program, the U.S. Environmental Protection Agency (EPA) eventually expanded nationwide permitting to cover them, including discharges from construction activities. By regulating construction stormwater, EPA and state permitting programs would target a pollutant source that was acknowledged to be a major cause of water pollution since the mid-1980s.

Starting up a nationwide permit program for construction sites presented some challenges. EPA needed to develop an approach that would work for the many thousands of construction projects that would be occurring at any one time across the country. EPA’s 1990 Phase I and 1999 Phase II stormwater rules would require permitting of an estimated 84,000 individual projects per year. This called for a system capable of processing and permitting a large number of sites. Recognizing that handling paper applications would overwhelm permitting offices, EPA and the states adopted electronic systems that were easy to use and gave government agencies the ability to process and manage large numbers of requests quickly.

Another challenge was that traditional NPDES permits that require in-depth permit application reviews and the development of site-specific permit conditions would not work for regulating construction sites. Permitting authorities endorsed using the general permit option under the regulations. This approach was intended for sources like construction sites that share similarities in the types of pollutants being discharged and the controls necessary to minimize their release into the environment.

Permitting authorities also faced the challenge of developing permit requirements for a type of discharge that was different than the typical industrial point source. Permit requirements for most point sources include effluent limits that are federally established for industrial discharges that share the characteristics of having predictable wastewater flow rates and that can be treated by technologies with well-studied rates of pollutant removal. By comparison, permits for construction stormwater would need to account for highly variable discharges that are influenced by many factors including differing precipitation patterns, hydrology, soils, etc.

Basic erosion and sediment control practices (e.g., preserving stream buffers, installing perimeter controls, stabilizing disturbed soils) were well understood to minimize the discharge of sediment from land-disturbing activities. Such practices had been implemented through local and state building ordinances, and they also gave permitting authorities a source of potential requirements that could be included in the new construction stormwater permits. The reliance on erosion and sediment control practices in permits was made official in 2009 when EPA issued its federal effluent limitations for the construction and development industry (the “C&D rule”), which required all construction stormwater permits to minimize pollutant discharges through implementation of these same types of practices. The C&D rule provided flexibility to permitting authorities on the specific control requirements but also defined certain minimum conditions, such as the requirement to stabilize soils immediately if construction will stop for more than 14 days.

Requiring implementation of these well-accepted practices in the first construction stormwater permits enabled NPDES authorities to effectively regulate the thousands of construction sites requiring permit coverage and provide a relatively uniform set of requirements. There are still opportunities for improvement. Data suggests that thousands of stream miles remain impaired for sediment or turbidity (accounting for close to 30% of all impairments by some estimates), and construction discharges are a contributing factor in these types of impairments.

Permits are a tool that could prove instrumental in targeting specific problems that will help rehabilitate these impaired waters. For instance, EPA’s most recently issued Construction General Permit and a number of state permits are strengthening controls for discharges to sensitive waters from dewatering operations, and more states are including specific restrictions for construction projects taking place in impaired or high quality watersheds. A number of permits also require construction operators to complete specific stormwater training to help improve compliance and to submit photographs documenting their site’s erosion and sediment control implementation. And still other opportunities exist to reduce pollutant loads from other pollutant sources such as trash, plastics and tire particles.

Working with state permitting programs, industry and the engineering community, EPA will continue to track progress and make adaptations to the permitting program as changes in the industry and technologies warrant. 

About the Experts

Christopher Clipper is an environmental protection specialist in the Water Permits Division of the U.S. Environmental Protection Agency.

Greg Schaner is attorney adviser in the Water Permits Division of the U.S. Environmental Protection Agency.

Flocculants for Stormwater Treatment: Balancing Safety and Sustainability

Figure 1. Chemical treatments improve the quality of water by removing the suspended and dissolved contaminants.

Flocculants and coagulants are vital tools used globally to improve water quality by removing harmful contaminants such as sediment, metals and excess nutrients. Industries such as stormwater, mining, agriculture, construction, drinking water, wastewater, and pond and lake management all rely on chemical flocculants and/or coagulants. Chemical treatments make it possible to remove suspended and dissolved contaminants efficiently and effectively from water to make it safe for consumption, use and/or discharge back to the environment (Figure 1).

With increasing population, industry and construction activity, a greater need for chemical treatments has led to increases in production and use globally and created interest and concern over chemical source and environmental fate. In a perfect world, available water treatment chemicals would marry effectiveness, safety (low toxicity) and sustainability (rapid degradation and renewable sourcing). Like most things, however, each treatment comes with advantages and disadvantages. The goal is to combat water quality issues in the most environmentally responsible ways possible by effective use of existing technologies and continued development of new technologies. Multiple existing treatments already offer effective and safe solutions for water quality issues. However, recent work has shown that combining specific types of existing polymers together can create new, more sustainable solutions.

Common Flocculants and Coagulants: Important Properties

Common flocculants and coagulants used for stormwater treatment include polyacrylamides (polymer flocculant), plant and animal-based biopolymers (starch/ cellulose, chitosan), and metal salt coagulants like alum. Flocculants and coagulants are both able to effectively treat water by separating suspended solids and contaminants from water. Coagulants work by destabilizing the charge on colloidal, suspended particles so they can settle out of solution. Flocculants enable particles to bind together, forming larger, heavier particles or “flocs” that rapidly settle.

Although each base material looks similar (white granule, flake or powder), they all have different properties that can affect their utility and desirability for specific applications (Figure 2). These important properties include effectiveness, toxicity, source material and environmental fate and are dependent on several factors.

Effectiveness of polymer flocculants is dependent on the molecule size (weight), charge (+ vs. -), and charge density (how much charge is on a polymer chain). Synthetic polymers can be any size but are generally much larger than natural polymers. Larger polymers can bind more particles, form larger floc, and are typically highly effective at low application rates. Their larger size also allows them to bind contaminants regardless of charge. For example, anionic and nonionic polymers can effectively and efficiently remove anionic clay particles despite both having negative charges. Positive (cationic) chemicals can bind directly to negatively charged particles like clay and sediment and are often very effective. However, the tradeoff is toxicity to gilled organisms as positive chemicals bind to negatively charged gill surfaces and cause suffocation.

Toxicity is mainly determined by flocculant charge: cationic (+) vs. anionic (-). Natural and synthetic cationic flocculants are effective for water treatment but carry a high toxicity to aquatic organisms (Liber et al. 2005, WA DOE 2019). Anionic polymers have 10-100x lower toxicity than cationic polymers (with the same effective rate) and are therefore the first choice of states regulatory agencies for environmental applications and typically do not require special permits for use. Biodegradability (environmental fate) is typically based on the source material such as synthetic vs. plant/ animal and its chemical composition and structure. Natural polymers are more easily degraded by bacteria and other microorganisms resulting in degradation in days to weeks, compared to months to years for large, synthetic polymers.

Figure 2. Each flocculant and coagulant has disadvantages and advantages that should be considered.

Common Flocculants and Coagulants: The Key Players

There are four common flocculants and coagulants (Figure 3).

  1. Polyacrylamides (PAM)

Large, anionic PAMs are the most widely used polymers for stormwater treatment. Widespread use is due to low toxicity, high effectiveness and ready availability. PAM has also been thoroughly utilized and studied with over 70 years of research and use as a soil amendment and more than 50 years as a water treatment chemical (Entry et al. 2002). Despite PAMs widespread use some states do not promote or allow the use of PAM over slow biodegradability concerns.

  1. Starch

Starch is one of the most widely used and available biopolymers as it is fully biodegradable and derived from commonly available plants such as corn, soybeans, potatoes, wheat and tapioca.  Anionic starch flocculants carry a low aquatic toxicity but are not commonly used for sediment and metal removal since they are less effective (Asharuddin et al. 2021) and require a dosage 2 to 10 times greater than PAM (Wang 2018, Lapointe & Barbeau 2015).

  1. Chitosan

Chitosan is a polysaccharide derived from shells of crustaceans. It has multiple uses in water treatment, pharmaceutical and pesticide industries. It is readily biodegradable and naturally sourced; however, it is cationic and has a high toxicity to aquatic organisms (like cationic PAM and starch). Its narrow margin of safety for aquatic organisms is why the U.S. Environmental Protection Agency and most states do not allow or require a special permit for use in environmental applications (USEPA 2022, FLDEP 2018, Illinois Urban Manual 2011, EGLE, EGLE 2021).

  1. Metal Salts (Alum)

Coagulants like aluminum and other metal salts are positively charged chemicals (not polymers) that neutralize the negative charge on colloidal particles and allow them to slowly settle out of solution. They are typically low cost and do not require mixing like polymer flocculants. However, many carry a moderate to high toxicity and they do not break down, so there are concerns of environmental fate and build up in the environment – particularly in sediment.

Figure 3: Four most common flocculants and coagulants.

Benefits of Combining Treatment Chemicals

Combining existing flocculants together such as anionic starch and PAM, has created new products that compound the advantages of the materials while minimizing the disadvantages.

Anionic PAMs are widely used and provide effective treatment with a high safety margin for aquatic organisms, albeit slow degradation. Some regulatory agencies and flocculant users look at chemical fate first and select naturally sourced and rapidly degrading products – in turn opting for cationic chemicals with higher toxicity, or less effective anionic flocculants such as starch. Combining synthetic and plant based anionic polymers may provide a solution to this problem, so we do not sacrifice safety or efficacy for degradability.

Blending anionic starch flocculants with anionic polyacrylamides can provide a low toxicity, high-margin-of-safety material that can effectively remove harmful contaminants from water while doubling the use of plant-based flocculants. These blended flocculants produce comparable results to PAM (Iwinski 2021) while including benefits such as increased biodegradability, sustainable sourcing (plants) and potentially reduced cost as PAM prices are subject to oil and gas availability and fluctuations.

Conclusion

We live in a world of relative risk and all advantages also come with disadvantages. All chemicals discussed in this article have inherent benefits of removing known and acutely harmful substances from water. As population and water quality concerns continue to increase, use of flocculants that strive to balance safety and sustainability will help us meet industry needs while working to preserve our natural resources.

References

Asharuddin, S., Othman, N., Altowayti, W., Bakar, N., & A. Hassan. 2021. Recent advancement in starch modification and its application as water treatment agent. Environmental Technology and Innovation 23.

EGLE. Michigan Department of Environment, Great Lakes, and Energy. Polyacrylamide, BMP Technical Data Sheet. https://www.michigan.gov/-/media/Project/Websites/egle/Documents/Programs/WRD/NPS/Tech/BMP/bmp-polyacrylamide.pdf?rev=704e168ca40a4ccb8649fd7fe4da068a.

EGLE 2021. Michigan Department of Environment, Great Lakes, and Energy. Polyacrylamide Products and Soil Erosion and Sedimentation Control Technical Guidance. https://www.michigan.gov/-/media/Project/Websites/egle/Documents/Programs/WRD/Storm-Water-SESC/polyacrylamide-products-technical-guidance.pdf?rev=a82bf9c21cc8434183da52892e1f3f88.

FLDEP 2018. Florida Department of Environmental Protection Florida Stormwater Erosion and Sedimentation Control Inspectors Manual, 2018. https://publicfiles.dep.state.fl.us/DEAR/DEARweb/Stormwater_training/Manual/FSESCI%20TIER%20I%20Manual%20100318.pdf.

Illinois Urban Manual Practice Standard, 2011. Polyacrylamide (PAM) for Turbidity. https://illinoisurbanmanual.org/wp-content/uploads/2018/08/PAM-for-Turbidity-Reduction-and-Sediment-Control-1.pdf.

Iwinski, K. 2022. Biopolymers and PAM: Evaluation of Novel Bio-Blend Polymer Logs for Removal of Suspended Sediment. IECA International Conference Paper, Minneapolis, MN.

Lapointe, M. & B. Barbeau. 2015. Evaluation of activated starch as an alternative to polyacrylamide polymers for drinking water flocculation. Journal of Water Supply: Research and Technology 64.3 (333-343).

Liber, K., L. Weber, & C. Levesque. 2005. Sublethal toxicity of two wastewater treatment polymers to lake trout fry (Salvelinus namaycush). Chemosphere 61 (1123-1133).

USEPA 2022. United States Environmental Protection Agency Construction General Permit. Appendix J – Suggested Format for Request for Chemical Treatment (updated 02/22). https://www.epa.gov/system/files/documents/2022-01/2022-cgp-final-appendix-j-request-for-chemical-treatment.pdf.

WA DOE (revised 2019). 2019 Stormwater Manual for Western Washington. https://fortress.wa.gov/ecy/ezshare/wq/Permits/Flare/2019SWMMWW/Content/Resources/DocsForDownload/2019SWMMWW.pdf.

Wang, D. 2018. Activated starch as an alternative to polyacrylamide-based polymers for in-line filtration of low turbidity source water. Journal of Water Supply: Research and Technology 67.5 (467-471).

About the Expert Kyla Iwinski-Wood, Ph.D., is an aquatic toxicologist with a passion for clean water and applying science to find real-world solutions. She is director of research and development for Applied Polymer Systems, Inc.

Business Is a Lot Like Dancing

Regardless of how long you’ve been in business or what position you hold, if you want to thrive in our or any industry, your understanding of market dynamics will determine your present and future success. As such, companies that really understand their markets are leaders who consistently explore the future, while excelling at, leveraging and exploiting the present.

They do this by, amongst other things, cultivating a culture of innovation and execution and competing with a truly differentiated business model that transcends the traditional me-too models that permeate our industry.

Much like a beautiful dance and dancers, they take specific and unique steps that, once mastered, keep their organizations nimble and poised for sustainable growth. They place themselves in the spotlight, which distances them from competition. The market turns their attention and dollars to these well-orchestrated companies.

More than a two-step, these leaders generally follow a seven-step path. These steps are the results of analyzing the following issues and finding the unique solution for their companies:

  1. Switching costs or switching barriers. Leaders who address switching costs move their companies from “nothing prevents my customers from going to my competitors” to “my customers are in lockstep with us for several years.”
  2. Recurring revenue. Companies that move from 100% one-and-done transactions to 100% recurring and flowing revenue streams create a sustainable financial base for the future.
  3. Earning versus spending focus. Focusing on earnings versus spendings by pivoting from incurring 100% of costs before earning revenues to earning 100% of revenues before spending a penny on cost of goods sold is another step successful leaders take.
  4. Supply chain. Taking bold steps to collaborate with supply chain partners can result in game-changing cost structures that are 30% or lower than competitors to further differentiate the company.
  5. Cost-sharing. Rather than assume all the costs for a product or service, successful business leaders work with business partners to shift and share costs equitably, which creates harmonious and trusted business partnerships.
  6. Scalability. Enhancing the organization’s capacity to adapt to increased workload or market demands is an important step in the dance of sustainable success.
  7. Business model. Business leaders can protect their organizations from competition and position their companies for ongoing success and growth by addressing the previous six steps in the business model that reflect the unique attributes of their market, consumers, business partners and workforce.

Leaders who have taken these steps to move away from the frightful position of “I have no barriers, uniqueness or moves that my competition can’t duplicate” to that envious “mic-drop — go ahead, let me see whatcha got” move! 

Judith M. Guido is the chairwoman and founder of Guido & Associates, a business management consulting firm in the erosion control and green industry. Guido can be reached at 818.800.0135 or judy@guidoassoc.com.

Timelines for Stabilizing Disturbed Land

Figure 1. Example of a suburban area housing development under construction. (Photo by Richard A. McLaughlin)

When land disturbing activities occur, a great deal of sediment can be generated from rain and wind, but often, at some point, an attempt to stabilize the site with vegetation is undertaken. The success of this effort can depend on many factors, and this is the subject of two studies in very different locations and types of land disturbance.

The effect of housing development on the amount of exposed area and impervious surfaces was determined using aerial photography for six municipalities in the Melbourne, Australia area from 2011–2020.1 The six were chosen because of the availability of frequent aerial imagery and rapid growth. Over the course of the study, the phases of development (site preparation, mass grading/major earthworks, roads and storm drains, house construction and landscaping) were determined within the various subdivisions. Mass grading took 1–1.5 years for most sites and resulted in 100% bare soil for much of this time. Road construction followed and took a similar amount of time, increasing imperviousness to 20%–30%. The year following resulted in more than 50% of the houses completed, with further construction slowing steadily for the next few years. Within-lot imperviousness was 73%–78% upon house completion, with overall subdivision reaching 66%–78%. Landscaping was complete three to four years after house construction started, with an overall timeline ranging from four to nine years to final development. The potential sediment delivery is highest during the grading phase but remains relatively high during road and house construction due to the greater imperviousness and direct connection to streams via the storm drain system. From a conceptual model, they estimated that 29% of potential sediment loss from this type of development was during the road and storm drain phase, and 27% was from the house construction phase (Figure 1).

The other study occurred at the other side of the earth in northern Northwest Territories, Canada, where approaches to reclamation of a diamond mine were being tested.2 This arctic site presented many challenges such as cold temperatures, low precipitation and short growing season.

Three substrates were produced as a result of mining operations: processed kimberlite (the diamond-bearing magma intrusion mined), crushed rock and lakebed sediment. Each of these were tested for vegetation growth alone or with amendment (sewage sludge or soil), microtopography (large and small mounds, depressions and boulders, furrows or flat) or a combination of one amendment and one microtopography. A mix of native grasses and forbs from the area were seeded, and vegetation analysis was done for up to four years.

The crushed rock had the best vegetation followed by the lakebed sediment, with very little vegetation on the kimberlite due to poor physical and chemical properties for plants. The microtopographic treatments had significant effect in the kimberlite, particularly in depressions, but had little effect in the lakebed sediment or crushed rock materials. Sewage sludge was generally beneficial in the first years but declined after that. After four years, crushed rock with sewage resulted in nearly 60% cover while only 6% in kimberlite. The soil salvaged from a stockpile had no beneficial effect, possibly due to the low application rate of approximately 2.5% by volume. A test of anionic polyacrylamide at 16.7 kg ha-1 for erosion control was also part of the study, but there were no effects detected. The authors suggested that a long-term study of the potential for these treatments to result in soil development and a stable cover will be needed. 

References:

Russell, K. 2021. Potential sediment supply fluxes associated with greenfield residential construction. Anthropocene 35 (2021) 100300. https://doi.org/
10.1016/j.ancene.2021.100300.

Miller, V.S., M. A. Naeth, S. R. Wilkinson. 2021. Micro topography, organic amendments and an erosion control product for reclamation of waste materials at an arctic diamond mine. Ecological Engineering 172 (2021) 106399. https://doi.org/10.1016/
j.ecoleng.2021.106399.

About the Expert

Rich McLaughlin, Ph.D., received a B.S. in natural resource management at Virginia Tech and studied soils and soil chemistry at Purdue University for his master’s degree and doctoral degree. He is a professor and extension specialist in the Soil Science Department at North Carolina State University in Raleigh, North Carolina, specializing in erosion, sediment and turbidity control.

Case Study: Putting Green Infrastructure to Work

Figure 1. The LEED Platinum-Certified WRD Albert Robles Center for Water Recycling and Environmental Learning purifies 14 million gallons of water per day for groundwater replenishment purposes and serves as an educational center.

The blank slate of a new project can offer invaluable opportunities for innovative design and construction methods. The design and construction of the Water Replenishment District’s (WRD) Albert Robles Center for Water Recycling and Environmental Learning (ARC) (Figure 1) offered one such opportunity with regards to green infrastructure and stormwater management in particular. However, WRD has further maximized the reach of this green infrastructure by using it to demonstrate the benefits of low impact development to the public through the site’s educational features.

WRD is the largest groundwater agency in the State of California, managing and protecting local groundwater resources for four million residents in southern Los Angeles County, the most populated county in the United States. This semi-arid region receives an average of only 14 inches (355 mm) of rainfall per year, therefore stormwater capture and infiltration are important goals for the highly urbanized and developed region. Keeping stormwater out of the storm drain system, which empties directly into the Pacific Ocean, helps increase local soil moisture and prevents the accumulation of stormwater pollutants which contaminate ocean water.

The Project

The ARC was constructed in 2019 in Pico Rivera, California with the primary purpose of producing 14 million gallons (53,000 cubic meters) of highly-purified recycled water per day for delivery to local spreading grounds for groundwater replenishment and has the esteemed secondary purpose of educating the public and stakeholders about the importance of groundwater, recycled water, stormwater and water conservation.

By making ecologically inspired design choices, WRD had enough green infrastructure and low impact development components to be awarded the United States Green Building Council’s Leadership in Energy and Environmental Design (LEED™) Platinum Certification in 2020. The LEED Platinum accreditation is a distinction that only 5.7% of buildings in the United States. The on-site integrated stormwater management system played a large role in achieving the certification.

ARC’s Integrated Stormwater Management System

The overall stormwater design at ARC was completed in adherence to the requirements of the California Regional Water Quality Control Board Los Angeles Region MS4 Permit and the Los Angeles County Department of Public Work’s (LACDPW) Low Impact Development (LID) Standards Manual. Specifically, the project was designed to retain and infiltrate the storm runoff volume from a 24-hour, 85th percentile storm event which is calculated to 0.95 inches (24.13 mm) and 11,200 cubic feet (317 cubic meters) of rainwater.

An integrated stormwater management system was installed to maximize onsite infiltration and on-/off-site groundwater recharge while also preventing pollutant loading off site. Components of this system include the following:

  1. Pervious pavement – The 130-stall parking lot consists of pervious concrete and pavers to control runoff and promote stormwater infiltration (Figure 2).
  2. Bioretention basins – Five bioretention basins installed around the site’s perimeter receive first storm flush flows and provide on-site flow retainment and infiltration.
  3. Underground treatment and infiltration system – The most significant aspect of the LID design is an underground treatment and infiltration system. Stormwater directed toward the system is filtered through a hydrodynamic separator that uses swirl concentration and continuous deflective separation to screen, separate and trap trash, debris, sediment and hydrocarbons from stormwater runoff. Once filtered, the water is detained and infiltrated through three underground, 96-inch (244 cm) diameter, 36-foot (11 m) long corrugated, perforated and interconnected pipes. This system is designed to capture and retain approximately 8,800 cubic feet (249 cubic meters) of runoff, exceeding the Storm Water Quality Design Volume (SWQDv) generated by an 85th percentile storm event.
  4. Green roof – WRD constructed a rooftop garden atop the Learning Center to capture and harvest rainfall (see cover). Excess roof runoff discharges to ground floor planters in front of the building. All landscaping on site consists of drought-tolerant or native plants and is irrigated with a low-flow drip system, thus further reducing stormwater runoff and potential pollutant discharges.
Figure 2. Pervious pavement and bioretention basins are used to infiltrate stormwater, and interpretative signs teach visitors about the anatomy and benefits of bioretention basins.

Project Challenges

The ARC site layout posed the biggest challenge to the stormwater design. Prior to the construction of ARC, runoff from the property was collected in swales and flowed into an inlet of the adjacent San Gabriel River. Because of the site’s proximity to nearby water bodies, it was important to minimize off-site pollutant loading and stormwater runoff from the site. It was determined that a combination of permeable pavement, bioretention basins and an underground stormwater treatment and infiltration system would manage all stormwater flows on site.

Furthermore, the project took a design-build approach. This helped to create an environment where all parties, including the project owner and manager, the general contractor, the design engineer of record and plant operators, were able to continuously collaborate throughout the design and construction of the facility. This resulted in an innovative facility that achieved all project goals. ARC has already seen two rain seasons and the stormwater capture features are working as designed.

Figure 3. A horticultural expert leads the WRD Eco Gardener classes through the ARC Demonstration Gardens.

Seeing is Believing

All aspects of the green infrastructure at ARC are incorporated into the numerous educational features on site. There are over 30 water-related exhibits in the Learning Center and an outdoor Demonstration Gardens containing 10 interpretive signs (Figure 2), drought-tolerant plants and a working model of the San Gabriel River and spreading grounds.

Understanding that “seeing is believing,” visitors can learn about stormwater capture, treatment and infiltration by seeing firsthand what these processes look like. Through on-site classes and tours, visitors are exposed to the sustainable features while reading interpretive signs and listening to a docent or instructor.

WRD hosts Eco Gardener classes on site where attendees tour the gardens and learn how to install a bioretention basin, drip irrigation and California native plants (Figure 3). Furthermore, docent-led LEED tours make stops at the pervious pavement, bioretention basins and green roof.

While ARC’s integrated stormwater management system has been critical in capturing, treating and infiltrating the site’s rainwater, the green infrastructure investments have also paid off handsomely for public education purposes. WRD hopes to inspire future environmental stewards and innovative green buildings by leading through example.  

About the Expert

Phuong L. Watson, PE, is a senior engineer at the Water Replenishment District of Southern California. She has over 20 years of experience working on projects related to groundwater quality, recycled water reuse and regulatory compliance. She is a registered professional engineer in the State of California and earned a bachelor’s degree in biology from the University of Southern California and a master’s degree in environmental engineering from California State Polytechnic University, Pomona.

MOST POPULAR